Monday, May 30, 2011

Interactive Atlas of NSW

The Atlas of New South Wales is an initiative of the Land and Property Management Authority and it was created with the objective of providing detailed statistics across a range of topics to educational institutions and the broader community. It is built with Bing Map so, provides very familiar to many, simple and intuitive interface to government information.

All the information is presented as a series of thematic map overlays in four categories:

  • People (eg. population, health, housing, religion, indigenous population, indexes of relative advantage/disadvantage, crime);
  • Economy (eg. labour force, taxation and revenue, and production of fruit and vegetables, oils and grins, and livestock);
  • History (eg. information on settlement, State elections and boarders); and
  • Environment (including vegetation, geology and soils, and locations of national parks).

Users have a choice between satellite image or roads map as a base layer and can adjust transparency level of thematic overlays. Each overlay is accompanied by a comprehensive legend, explaining the meaning of presented data. A click on individual region brings up a pop-up window with information about the region, presented as charts and gauges.


The Atlas of New South Wales is quite responsive considering the amount of data that is required to present thematic overlays. It would benefit though from a bit more legible charts and access to source data in a tabular format and/ or for download. Overall, the application is well built and very simple to navigate through.

Thursday, May 26, 2011

Free data a GFC casualty

The US government has been a proponent of free data for quite a while now and over the years it established a number of national programs to allow easy access to wast resources of public information. However, the annual budgets for e-government initiatives were slashed by 75% last month, putting in question the survival of such programs like data.gov (it is the repository for publicly available data that was promised as a platform to power software and analysis created by and for the public). Comments from federal CIO Vivek Kundra indicate that data.gov will not be shut down but “…there will be no enhancements or other development to address needs for improvement”. So, although the policy of free data remains unchanged, significant cost of delivering that policy may be its ultimate “undoing”.

Meantime, in Australia, the progress towards opening up government data vaults has taken another step forward. Earlier this week Australia's Information Commissioner, John McMillan, unveiled eight new rules for Federal agencies to adhere to when considering the publication of government data. These rules are:

  • Open access to information – a default position,
  • Engaging the community,
  • Effective information governance,
  • Robust information asset management,
  • Discoverable and useable information,
  • Clear reuse rights,
  • Appropriate charging for access, [So, not entirely free access!]
  • Transparent enquiry and complaints processes

The Principles are not binding on agencies, and operate alongside legal requirements about information management that are spelt out in the FOI Act, Privacy Act 1988, Archives Act 1983 and other legislation and the general law.

Despite the launch of data.gov.au portal, there is no federal program in Australia to facilitate access to public data on a large scale (ie. the US style) and the onus so far is on individual agencies to manage the dissemination of public information in their possession. State and Territory governments are pursuing their own initiatives. This “piecemeal approach”, although slower in implementation, may prove to be a more sustainable model for enabling access to public data, considering the vulnerability of large scale initiatives to budgetary pressures of the government of the day in these uncertain times.

Monday, May 23, 2011

Geospatial Revolution continues

Pennsylvania State University has just released another short video in the series titled “Geospatial Revolution”. This is the fourth 15 min. episode outlining virtues of geospatial technologies and how they can assist scientists and local communities.

Episode 4 is divided into four chapters. The first chapter explains how experts studying climate change use digital maps to monitor glacier ice melt, deforestation and carbon emissions over time. Another chapter explains how geospatial technology can help aid workers anticipate food shortages around the world. The following chapter explores how geospatial technology helps track the spread of disease. And the closing chapter highlights the Map Kibera project, which empowered the people of an unmapped area of Nairobi, Kenya to map their essential facilities and provide a voice for the more than 200,000 residents.

Bookmark and share all 4 episodes via aus-emaps.com YouTube video player.


Related Posts:
Geospatial Revolution

Thursday, May 19, 2011

Mapping feral animals in Oz

Over the last two centuries Australia has been plagued by many feral animal brought in by settlers from Europe and other parts of the world. This includes rabbits, foxes, camels, pigs and many, many more species. FeralScan is a collaborative project between Federal and State Governments, private organisations and community to map and monitor distribution of various feral animals on Australian continent. By mapping the damage caused by these animals, FeralScan can help to identify when, where and how to control these animals in order to reduce their impact on the environment.


For example, there are more than 1 million wild camels currently roaming the Australian desert and causing damage to water supplies and disturbing Aboriginal communities. CamelScan, a crowdsouced initiative under FeralScan project, allows anyone to report sightings of feral camels in Australia on a Google Map. Thanks to this initiative scientists involved in the project will be able to develop regional maps, as well as national picture of where feral camels occur, and work out where they congregate in different seasons.


First spotted on : Google Maps Mania

Thursday, April 7, 2011

Maps and property investment

There is an old adage that the three most important rules for selecting a property for purchase are: location, location, location. So, maps should be one of the primary tools in making the purchase decision. With the advent of Google Maps, Bing Maps and plethora of other online mapping applications, all real estate portals integrated mapping based search options into their websites. However, mapping applications presenting analytical information on the state of the property market in various parts of the country are only starting to be brought to life.

Property Investment Map on domain.com.au is the first analytical map released by the major Australian real estate portal. It contains a set of thematic overlays presenting information on gross rental yields, capital gains, vendor discounts and top performing areas - by suburb, for the entire Australia (excluding ACT). Information is available separately for houses and units, as 1 year or 5 year trend measures.


Property Investment Map provides invaluable insights into the dynamics of the property market on a local scale. For example, using the map investors can pinpoint suburbs with good rental yields and capital growth prospects. These areas are the most desirable for investors as high rental yields imply attractiveness of the location to renters as well as availability of properties at prices still offering good value. At the same time, high capital gains yields over short as well as longer term imply consistency in appreciation of properties in a given area over time. Eastlakes in central Sydney is one suburb displaying such characteristics in relation to units -median price increased 17% in 2010 and further rise of 3% is predicted for 2011.


Totally different market dynamics can be demonstrated on example of Rozelle, a suburb just west of the CBD. Despite showing high gross rental yield for units in the last year, it has relatively low rates of capital gains over one as well as 5 year period. It could imply this suburb was overpriced in the past and only now rental yields for units have increased to the level that makes them attractive again for investment purposes (median price dropped 4% in 2010 and prediction for 2011 is 0% growth). If history is to repeat, there is a good chance prices could overshoot again if Rozelle is suddenly “rediscovered” by investors. Property Investment Map cannot give all the answers so, the picture would have to be validated with local knowledge before making any decisions.

Property Investment Map should be in the toolbox of not only investors but also anyone serious about purchasing a property. The only limitation of the map is lack of details on how the information was derived (eg. methodology for data range determination). It is a good starting point for deciding on alternative locations for investment, although it would also be nice to have a numerical version of the dataset available for more detailed comparisons.


Related Post:
WA housing affordability index
AllHomes Property Map
REIV maps auctions statistics
Map of Melbourne house prices
Sydney house prices

Wednesday, April 6, 2011

Spatial services directory

The task of finding the right supplier is never easy, especially when services are concerned. Industry specific directories can be a good starting point for preselecting potential candidates for contact and further evaluation. SpatialSource.com.au is the leading portal for the Australian spatial industry. It publishes a directory of suppliers of “all things spatial”. There are over 200 providers listed in a variety of categories, divided into five main groups: Data Supply, Geospatial Services, Hardware Supply, Services to Spatial Industry and Software Supply - from top tier multinationals to small operators like aus-emaps.com. Bookmark the following link for your future reference: http://directory.spatialsource.com.au/

If you are a local supplier of spatial products or services consider registering your company in Spatial Source Online Directory - listing is free. The directory offers good exposure to potential customers. Help your prospective clients find you!

Related Post: New spatial industry news portal

Monday, April 4, 2011

Disasters and maps

7 February 2011 marked the second anniversary of the worst bushfire tragedy in Australian history - 173 people died and 414 were injured as the result of infernos raging around the State of Victoria. The Black Saturday Bushfire was a very traumatic event for many Australians, those directly affected by the fires but also those thousands who got emotionally and personally involved in post event forensic studies, clean up, counselling, rebuilding, Royal Commission and general assistance through voluntary work or collection of donations. The whole nation felt the pain and helplessness in the wake of such an enormous tragedy.

After a period of a relative calm over the last two years Australia has been struck again by several major natural disasters, such as flush floods in Queensland and Victoria, tropical cyclone Yasi, or bushfires in Western Australia. Events like these bring online crowds of people: those caught inadvertently in the incidents, or those concerned about safety of their family members and friends, but above all, “curious onlookers” from around the world who just would like to know what is happening. All those people are looking for basic information, such as maps of places to identify where “these things” reported in commercial and social media are happening, as well as anything that relates to progress of the event, likely scenarios it may evolve into and the impact on people, infrastructure and the surrounding environment.

In the first instance they turn to official sites run by State authorities - those that issue the alerts and warnings - and of course the Australian Bureau of Meteorology. When they can’t find what they are looking for, or the information is not in the format that is meaningful, they turn to online search engines seeking more details about the event. It is therefore not a coincidence that during the times of natural disasters the traffic to sites providing information on maps goes through the roof. A question comes to mind if there really is enough tools in the public domain to keep general public fully informed. Has anything changed since Victorian bushfires of 2009?

In an ideal world, all the relevant information would be provided by the authorities, along with alerts, warnings, evacuation orders, road closures and detour routes, situation briefs etc. And through all possible channels: online, stationary and mobile phones, radio and TV, and in all formats: text, audio and video broadcasts and online streaming, printed as well as static and interactive maps, and above all, web services for republishing the information through media and social channels. But that is still only a distant dream. The reality is that information is very fragmented, differs in formats and content from State to State and ultimately in reliability, accuracy and timeliness.

So, what information is actually available, in spatial format, to an average person interested in a particular event? Let’s start with bushfire related information as there is quite a few resources available...


Part 1: Mapping Bushfires

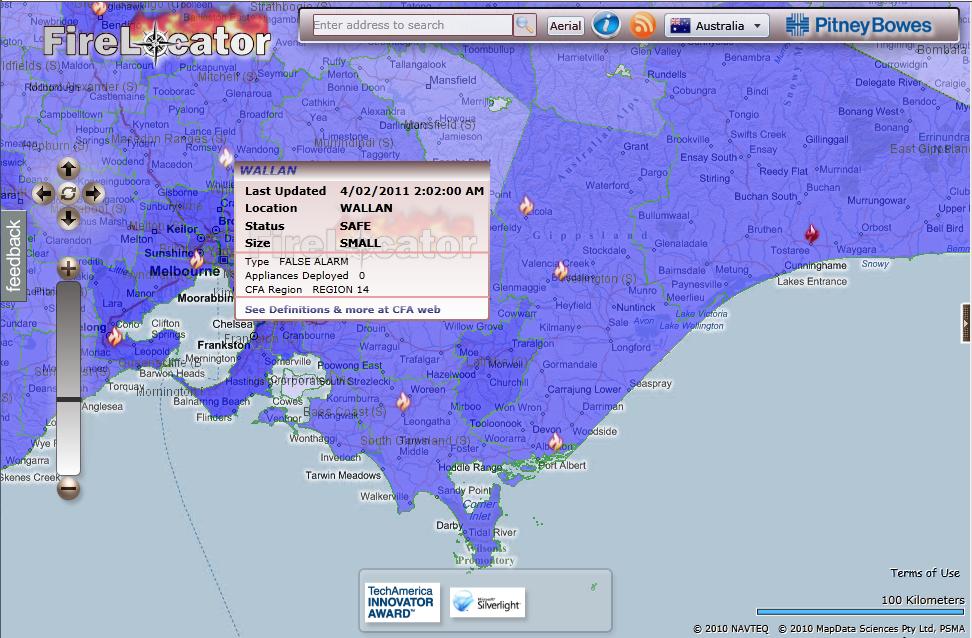
Detection of fire hotspots from satellites has been around for quite a while and Australia has two systems delivering such information that pre-dates Victorian bushfires of 2009: Geoscience Australia’s Sentinel and Landgate’s FireWatch. Both are using data obtained from the NASA Earth Observation Satellites Terra and Aqua which pass over Australia up to three times a day (although a revisit of the same area is only two times a day). Although data has some limitations, like timeliness due to infrequent revisit cycle or inability to detect hotspots through thick smoke and clouds, these applications provide excellent location reference for larger fire outbreaks throughout Australia. Geoscience Australia publishes the data in KML, WFS and WMS formats. I use those in my Hazard Monitor Bushfire Incidents map to publish an alternative view of the information. FireLocator from PitneyBowes provides yet another version of the same data in Silverlight format and with Bing Map in the background.

North Australia Fire Information is an application dedicated to monitoring fires in the northern part of Australia. In addition to satellite detected fire hotspots it also includes information on fire scars from past bushfires. Some of the information available on this site can be accessed in KML and WMS formats.


State authorities responsible for emergency alerts and response to natural disasters are publishing on their respective websites summaries of information on the latest incidents. Victorian Country Fire Authority (CFA) publishes a summary of incidents in a tabular format and on a Google Map. The information is also available as RSS feeds (locations are not georeferenced, hence cannot be directly imported into maps).

In NSW Rural Fire Service (RFS) publishes its version of summary of incidents - as a list and a map. Georeferenced RSS feed is also provided.

Both Bushfire Incidents map and FireLocator (developed in late 2009) are using the above feeds to display information about the latest incidents on the maps. During the peak of Victorian bushfires Google released its own application that mapped these feeds and showed satellite imagery of smoke and cloud cover.

Tasmania Fire Service (TFS) is another agency that publishes fire incidents information and a map as well as distributes the information via RSS (non-georeferenced) and KML. And South Australian Country Fire Service (CFS) publishes map and incidents in a similar fashion to already mentioned States (their RSS feed is also not georeferenced).


There are no interactive maps with the latest incidents for Queensland and Western Australia and those states do not publish RSS feeds in the format that could be easily reused for displaying the information in third party mapping applications.

The most recent additions to the list of online bushfire related information sources are BushfireConnect and everymap.com.au. Built with Ushahidi, these online mapping applications aim to publish information supplied by the public located in the affected areas, either by lodging reports online, or via SMS or Twitter (ie. crowd sourcing). They also republish RSS alerts from State authorities. Not the easiest and the most intuitive tools to use but these initiatives are attempting to engage a wider community in reporting of incidents so, deserving all the support.

At the time of major disasters media and private individuals create maps and various applications to share the information about a particular event. Examples include a Black Saturday feature created by ABC that allows users to explore timeline of events on an interactive map, or Google’s MyMap version created by a private individual as a static record of events (presented here on aus-emaps.com shareable map).


[to be continued…]


Related Posts:
Perth Bushfires