Monday, May 30, 2011

Interactive Atlas of NSW

The Atlas of New South Wales is an initiative of the Land and Property Management Authority and it was created with the objective of providing detailed statistics across a range of topics to educational institutions and the broader community. It is built with Bing Map so, provides very familiar to many, simple and intuitive interface to government information.

All the information is presented as a series of thematic map overlays in four categories:

  • People (eg. population, health, housing, religion, indigenous population, indexes of relative advantage/disadvantage, crime);
  • Economy (eg. labour force, taxation and revenue, and production of fruit and vegetables, oils and grins, and livestock);
  • History (eg. information on settlement, State elections and boarders); and
  • Environment (including vegetation, geology and soils, and locations of national parks).

Users have a choice between satellite image or roads map as a base layer and can adjust transparency level of thematic overlays. Each overlay is accompanied by a comprehensive legend, explaining the meaning of presented data. A click on individual region brings up a pop-up window with information about the region, presented as charts and gauges.
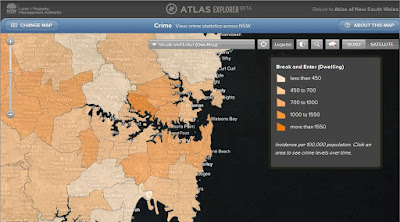

The Atlas of New South Wales is quite responsive considering the amount of data that is required to present thematic overlays. It would benefit though from a bit more legible charts and access to source data in a tabular format and/ or for download. Overall, the application is well built and very simple to navigate through.

Thursday, May 26, 2011

Free data a GFC casualty

The US government has been a proponent of free data for quite a while now and over the years it established a number of national programs to allow easy access to wast resources of public information. However, the annual budgets for e-government initiatives were slashed by 75% last month, putting in question the survival of such programs like data.gov (it is the repository for publicly available data that was promised as a platform to power software and analysis created by and for the public). Comments from federal CIO Vivek Kundra indicate that data.gov will not be shut down but “…there will be no enhancements or other development to address needs for improvement”. So, although the policy of free data remains unchanged, significant cost of delivering that policy may be its ultimate “undoing”.

Meantime, in Australia, the progress towards opening up government data vaults has taken another step forward. Earlier this week Australia's Information Commissioner, John McMillan, unveiled eight new rules for Federal agencies to adhere to when considering the publication of government data. These rules are:

  • Open access to information – a default position,
  • Engaging the community,
  • Effective information governance,
  • Robust information asset management,
  • Discoverable and useable information,
  • Clear reuse rights,
  • Appropriate charging for access, [So, not entirely free access!]
  • Transparent enquiry and complaints processes

The Principles are not binding on agencies, and operate alongside legal requirements about information management that are spelt out in the FOI Act, Privacy Act 1988, Archives Act 1983 and other legislation and the general law.

Despite the launch of data.gov.au portal, there is no federal program in Australia to facilitate access to public data on a large scale (ie. the US style) and the onus so far is on individual agencies to manage the dissemination of public information in their possession. State and Territory governments are pursuing their own initiatives. This “piecemeal approach”, although slower in implementation, may prove to be a more sustainable model for enabling access to public data, considering the vulnerability of large scale initiatives to budgetary pressures of the government of the day in these uncertain times.

Monday, May 23, 2011

Geospatial Revolution continues

Pennsylvania State University has just released another short video in the series titled “Geospatial Revolution”. This is the fourth 15 min. episode outlining virtues of geospatial technologies and how they can assist scientists and local communities.

Episode 4 is divided into four chapters. The first chapter explains how experts studying climate change use digital maps to monitor glacier ice melt, deforestation and carbon emissions over time. Another chapter explains how geospatial technology can help aid workers anticipate food shortages around the world. The following chapter explores how geospatial technology helps track the spread of disease. And the closing chapter highlights the Map Kibera project, which empowered the people of an unmapped area of Nairobi, Kenya to map their essential facilities and provide a voice for the more than 200,000 residents.

Bookmark and share all 4 episodes via aus-emaps.com YouTube video player.


Related Posts:
Geospatial Revolution

Thursday, May 19, 2011

Mapping feral animals in Oz

Over the last two centuries Australia has been plagued by many feral animal brought in by settlers from Europe and other parts of the world. This includes rabbits, foxes, camels, pigs and many, many more species. FeralScan is a collaborative project between Federal and State Governments, private organisations and community to map and monitor distribution of various feral animals on Australian continent. By mapping the damage caused by these animals, FeralScan can help to identify when, where and how to control these animals in order to reduce their impact on the environment.


For example, there are more than 1 million wild camels currently roaming the Australian desert and causing damage to water supplies and disturbing Aboriginal communities. CamelScan, a crowdsouced initiative under FeralScan project, allows anyone to report sightings of feral camels in Australia on a Google Map. Thanks to this initiative scientists involved in the project will be able to develop regional maps, as well as national picture of where feral camels occur, and work out where they congregate in different seasons.


First spotted on : Google Maps Mania