Showing posts with label How To - Guides and Tutorials. Show all posts

Monday, June 6, 2016

Data viewing in MapDeck

There are two ways to view data on MapDeck: either in a preview mode, using Data Viewer app, or via one of the purpose-built applications, such as Thematic Mapper or Sales Area Management Tool.
 

MapDeck’s functionality is broader than that of a traditional web-mapping application. That is, MapDeck is a consolidated publishing, cataloguing and information visualisation platform all in one. It enables specialised apps and associated data to be put to immediate use, the user requiring nothing more than just a web browser. 

Spatial data (vector geometry and image layers), tabular data (attributes), graphic and other files, as well as apps, are all listed in the MapDeck catalogue independently of each other. It is up to the individual user to find and select the right content that is suited for a particular purpose.

So, for example, if the primary interest of the user is in graphic/pdf maps or spatial data in the original GIS format, these files can be downloaded to a user computer and then opened with the user's favourite desktop software.

Any other table, map layer or vector data published on MapDeck can be previewed on its own in a generic Data Viewer app (provided you have access to that data set - that is, you are the owner or it is either a public dataset or you have subscribed to it). In other words, Data Viewer is a default app which displays content of a table, map layer or vector data set when a user clicks on a particular product.


Functionality of Data Viewer is very basic. In particular, vector geometry will be rendered in a preview window with a default style only and it will be presented on its own, with no option to display other contextual information. However, the data can be interacted with. That is, users are able to zoom in and out, pan the map and click on individual features to view attribute information, and vector features will respond to mouse-over events. Switching from “Map View” to “Table View” allows previewing attribute information for a given vector geometry and downloading it as a .csv file.


Image map layers are displayed in Data Viewer as an interactive map with pan and zoom functions enabled. Complex map layers, that is those comprising two or more sub-layers, will display just the top-most layer in Data Viewer and there is no option to switch between the sub-layers in a preview mode.


Attribute data tables can be previewed in Data Viewer’s Table View window.

Another option to view private and public tables, map layers, vector geometry, as well as compiled information directly in a browser, is to load them into a relevant MapDeck app.

MapDeck apps are purpose built tools that enable performing one or more (but very specific) tasks, like creating an interactive map (Thematic Mapper), defining and managing franchise or sales territories (Sales Area Management Tool), generating map images for printing in large format (Map Image Capture Tools) or configuring external web map services as MapDeck image map layers (Map Layers Management Tool). More options are coming.  

Once the user selects and starts a particular app, relevant data can be added and visualised using a common process which comprises of two steps: searching for content via the in-bulit Finder function and then selecting the item to add to the app.


Thereafter, each app deals with imported data in a unique way. For example, Thematic Mapper allows adding multiple image map layers as well as vector geometry layers, which then can be styled according to user preferences. Sales Area Management Tool only allows swapping one-base image map layer with another but it allows applying unlimited number of styles to imported vector polygon geometry to highlight different sales or franchise territories. And Map Image Capture Tool displays only information preconfigured and saved as Thematic Mapper or Sales Area Management Tool infosets.

At first, viewing data and information on MapDeck may appear as complex and ambiguous process – after all, you have to find what you are looking for in a large catalogue and then you have to create your own compilation of information rather than being given “a ready-made map”.  However, once you are familiar with the process, it is a very simple and straightforward task.

Just remember, to preview the data – all you need to do is click on a start icon to launch it in Data Viewer. For everything else is a Mapdeck app - launch it first, then add the data you are interested in. As simple as that!


Monday, May 9, 2016

Explaining holes in Postcodes 2016 coverage

When displaying Postcode Boundaries, Australia 2016 on a map you will notice that there is a lot of “empty space”. The expectation is that postcodes should cover the entire country, yet this is not the case for the reasons explained below.

Defining postcode boundaries should be a straightforward exercise since:
  • Australia Post officially declares that “postcode numbers are applied only to officially gazetted localities”, and since
  • gazetted localities cover, without overlaps, almost the entire continent, therefore
  • combining gazetted localities with a list of allocated postcodes should allow creating postcode boundaries that cover Australia without the gaps.
Simple, right? Not quite…


Australian Postcodes 2016 coverage

The reality is that:
  • There are places around Australia which do not have officially gazetted localities. For example, there are places with no permanent population (in the case of North West South Australia for example) or which have no formal recognition by local authorities for whatever reasons (in the case of Canberra surrounds). Hence, no postcodes can be allocated to those areas.
  • There are places which have gazetted localities but, for unknown reasons, those locations are not recognised by the Australia Post. So, they do not have postcodes assigned to them. This happens mainly in NT and Queensland but also for locations such as national parks or similar, mostly remote and uninhabited places.
  • There are places which are not officially gazetted localities so have no defined boundaries, yet they have assigned postcodes by the Australia Post. Point in case is the locality of Majura near Canberra with the allocated postcode number 2609. To make things more complicated, this locality also covers the officially gazetted locality of Pialligo (with the same allocated postcode number so, no big drama) but it also partially overlaps Canberra’s suburb of Watson which has a postcode number 2602.
  • Then there may be cases of locations that could be on the Australia Post postcode list but are not referenced with a postcode number in publicly available version of the list. So, such locations cannot be identified outright - unfortunately, Australia Post does not license freely its information.

As you can see, despite all the good intentions, the reality is quite messy. Therefore, the only way to deal with this complexity is to stick to a strict definition of what postcode boundaries should be. That is, to the Australia Post defined relationship between postcode numbers and locations where: “Postcodes are only allocated to localities officially gazetted by State land agencies”.

This way all major metropolitan areas are well covered with postcode boundaries and the issue of “gaps in coverage” is limited mainly to small, rural communities. The downside is a map that appears to have large chunks of Australia not covered in postcodes.


Using postcodes as a “widely recognisable and understood spatial reference to locations” is a deceivingly attractive proposition. In particular:
  • postcode numbers are part of an address, hence, theoretically, postcodes can be easily linked to specific locations;
  • everybody knows their postcode so it is very easy to solicit that information from clients or respondents to a survey, or from persons enquiring about a service, etc.
  • it is easy to use postcode groups to define sales territories or franchise areas,
  • postcodes are convenient for information aggregation purposes, without the need to resort to time consuming and potentially expensive geocoding of input data,
  • postcodes are large enough to provide good level of anonymity, so input data cannot be attributed to its sources (ie. inputs can be “confidentialised”),
  • at the same time, postcodes are small enough to highlight differences or similarities between local neighbourhoods. 

However, using postcodes boundaries is not without some serious issues due to:
  • ambiguity of how postcode numbers refer to locations,
  • existence of many versions of data at any particular point in time, and
  • their constant change.

You will find additional informaion on the limitations of postcode boundaries in our earlier articles on this topic:

Australian Postcodes User Guide
Comparing ABS Postal Areas 2011 and Postcode Boundaries 2016


All in all, gaps in Postcode Boundaries, Australia 2016 are the result of the methodology applied in creation of this dataset. MapDeck version of postcode boundaries may not suit all purposes and users should have a proper understanding of the limitations of this data set if they intend to make any use of it. 

Our recommendation is that, it is best to avoid postcodes (any version) and use instead more voluminous (in terms of count and data size) but more stable over time gazetted localities boundaries.

Friday, April 29, 2016

Comparing ABS Postal Areas 2011 and Postcodes 2016

Postal area boundaries, created by the ABS for the purpose of publishing 2011 Census statistics, are becoming dated. No updates have been announced as yet so, the question is, should you still be using this dataset?

You will need to consider two issues to answer this question:
  • what data are you going to reference to postcode boundaries, and;
  • whether there is a material difference between the 2011 representation of postcodes and their more up-to-date version in the area of your interest.

Despite the fact that ‘Postal Areas’ data is more than five years old, it is still the only option to use with Census 2011 statistics. It will be more than a year before any data from the upcoming Census 2016 is made available. So, the 2011 version of ‘Postal Areas’ will continue to be relevant for a while yet.

However, if you are working with other data, such as ATO statistics or recent survey data that reference respondent postcodes, then the more up to date representation of postcodes is the recommended option - choose ‘Postcode Boundaries, 2016’ edition then.

Both datasets are available for free perusal with MapDeck apps and the 2016 version can be downloaded in .shp format for a small fee.

Rural Victoria: Postal Areas 2011 in red and Postcodes 2016 in blue


The difference between these two versions of postcode boundaries datasets can be quite dramatic in rural areas (as the above example demonstrates) but it is generally less pronounced in long-established metropolitan areas.

Sydney Metro: Postal Areas 2011 in red and Postcodes 2016 in blue


You can compare how both boundaries  match in specific locations using a free version of the Thematic Mapper app (available to registered MapDeck users). Contact aus-emaps.com for an invite code to sign up for the MapDeck platform.

Friday, February 15, 2013

How not to build map portals

Anyone who tried to build a map based application or mapping portal will appreciate this light-hearted but very informative series of posts from Brian Timoney, titled Why Map Portals Don’t Work. There are 3 articles published so far, out of 5 planned on this topic. I share author’s views to the point but I will not even attempt to summarise the articles here - I could not possibly convey the message as well as Brian did. So, I will only limit the rest of my post to quoting a few gems:


…if you are building any public-facing interface you have exactly four requirements:

                   FAST  •  INTUITIVE  •  INFORMATIVE  •  FAST

Saying “no” to the premise of a single map portal serving both internal users and the general public is the prerequisite to building anything that will meet the four non-negotiable criteria stated above.

Map Portals Over-Focus on the Map, Under-focus on Text-Based Search and Discovery.

…build your simple single-topic maps to address the most common use cases…
single-topic maps get more than 3x the usage of [complex] portals.*

…slapping all of your layers on a single interface to placate the most demanding 3-5% of your audience sabotages the user experience of the vast majority.
* Based on a study undertaken by Brian Timoney of Local Government Maps for Denver


There are myriads of map portals and applications on the web that Brian’s comments directly apply to – some of my early applications as well. But I have learnt the lesson the hard way. If you are serious about saving time and cost, and creating great experience for your users, read the articles! Start your reading with this post that present results of a research “How the Public Actually Uses Local Government Web Maps: Metrics from Denver”. In itself it is quite telling piece of evidence of what works and what doesn’t work for map portals!


Direct links:
Why Map Portals Don’t Work – Part I
Paralysis of Choice: Why Map Portals Don’t Work, Part II
The Tyranny of “Requirements”: Why Map Portals Don’t Work, Part III

Saturday, July 7, 2012

Census 2011 Online Maps User Guide

This is a comprehensive introduction to a free online application available on @ aus-emaps.com website and called Census 2011 Online Maps. The application contains a selection of Australian 2011 Census of Population and Housing data published by the Australian Bureau of Statistics. It is designed specifically to facilitate creation of custom thematic choropleth maps with Census 2011 data (that is, maps are not predefined upfront and each is generated “on the fly”, according to user specifications).

Let’s start with some warnings and tips which will help in creating meaningful and informative maps.

Warning 1: Mapping Census data for the entire country poses some challenges since there are very significant differences between individual regions of Australia. Take for example median weekly personal incomes that vary from $76 to $8,312. It is therefore more practical to generate maps for smaller areas, such as individual States, rather than attempting to create a meaningful summary measure for the country as a whole.

Warning 2: Thematic choropleth maps are considered not suitable for mapping absolute values (eg. counts of persons). If absolute values are used for mapping areas that vary in size, misleading maps can be produced.

On the other hand using ratios, which show the relationship between two quantities, eliminates the influence of area, so that the map becomes meaningful by portraying accurately the distribution of features. Therefore, it is recommended to use only datasets labelled as “proportions” or “median values” for thematic choropleth mapping.

Nevertheless, there are legitimate cases where mapping absolute values can be justified. For example, when geography areas are of equal size (which is most likely the case with smaller geography units and/or urban locations) or when you deliberately want to “visualise absolute numbers” to help in defining territories based on counts of people with certain characteristics (since it easy to identify on the map which polygons are next to each other).


GENERAL INFORMATION

Base Geography:

The first release of Census 2011 Online Maps offers only one geography option - Postal Areas (which are good approximation of Australia Post Postcodes).

Data:

Census 2011 Online Maps application provides convenient access to approximately 150 datasets selected from the Basic Community Profile (only a fraction of 7942 individual datasets published by the ABS but of most interest to all). This initial selection will be extended in due course. 

Where appropriate, “proportions of total” for individual datasets were calculated and added to selection. There is also an overall “population density” dataset available for mapping. Full list of available datasets can be downloaded in a csv format by clicking on the following link: Census 2011 Online Maps Data List.


CONFIGURING MAPS

Start with clicking on a blue configure map text in the top right corner of the page, then follow the steps below.

Data Selection:

To simplify selection of individual datasets they have been grouped into themes and topics.


Select Theme:
Select from a dropdown list: Persons, Family or Dwellings

Select Topic:
Select relevant topic from a dropdown list (topics are specific for individual themes).

Select Data Item:
A list of available data items for a given theme and topic will be printed on the page. Select dataset of interest by clicking on the relevant box. Your selection will be indicated by change of box colour to a light blue. 

Tip: to reload the current selection just “unselect” and “select” it again by clicking twice on the light blue box.


Region Selection:

Select from a dropdown list. Options include Australia, States and larger capital cities. Default is “Australia”.

Changing region will trigger data refresh (ie. histogram, summary statistics, and data ranges will be recalculated and reloaded).


Data Exclusions:

Sometimes data is not available for all locations, either due to confidentiality or lack of valid answers to Census questions. By default empty cells are not counted in calculations of data statistics (ie. counts, mean and median, etc).

Some data series have lots of zero values. Users have an option to remove cells with “0” from calculations of data statistics. Changing option will trigger data refresh (ie. histogram, summary statistics, and data ranges will be recalculated and reloaded).


Histogram Customisation:

Default method for calculating optimal number of histogram bins is sq root of count of records, divided by 2 and rounded to a full number. Users can adjust the number of bins for a histogram by typing in a preferred number. It will trigger data refresh (ie. histogram will be reloaded).


Selecting Best Data Classification Method:

Start with inspecting histogram to determine how data is distributed. General rule is that for normally distributed data (symmetrical, bell shaped histogram) Standard Deviation is the optimal method for defining values for range breaks.

[Example of histogram of normally distributed data]

In this application St Deviation with 3 classes defines range breaks at -1SD and +1SD. With 5 classes, range breaks are placed at -1.5SD, -0.5SD, +0.5SD and +1.5SD.


Equal Range (also known as Equal Distribution or Interval) is the best option for uniformly distributed data (histogram with bars of similar height) as for example, Median Rents for QLD.

[Example of histogram of uniformly distributed data]


In Equal Range breaks are determined by dividing the difference between max and min values by the selected number of ranges. This method can result in ranges with few or no records, if used with other than uniformly distributed data.


The majority of Census data will have irregular distribution for which Natural Break or Quantiles classification methods are the most appropriate.

[Example of histogram of irregularly distributed data]

Jenks algorithm is used to determine range breaks for Natural Break classification. The algorithm groups data into classes that are themselves as separate as possible, but where the data values within each class are fairly close together. That is, it maximises the differences between the classes and minimises the differences within the classes. This classification can be used to discover spatial patterns within the data, but it can lead to some classes being populated by low numbers of observations. ABS recommends Natural Break as a default classification for Census data but prefers an alternative methodology, based on the Dalenious Hodges algorithm.


Quantiles also work well with irregularly distributed data and this is probably the most well known data classification method. Range breaks for quantiles are calculated by sorting data in an ascending order and dividing into equal parts, based on the number of selected classes. Therefore each range will contain a similar number of units (ie. equal count or proportion of records, polygons). If the entire dataset is divided into halves, the range break is a median. Dividing data into four classes produces quartiles separated by three range breaks. Quintiles have five classes with four range breaks.


The fifth classification method available in Census 2011 Online Maps is “Custom Ranges”. Simply, type in your preferred values in relevant boxes to overwrite automatically generated numbers.


Min and Max values are used to define respectively the lower and the upper limits for the “outer ranges”, inclusive of these numbers. Selectors can be adjusted to exclude those values from ranges, if required.


Changing Classification Method and Colour Scheme:

Select Classification Method:
Select from a dropdown list: St Deviation, Equal Range, Quantiles or Natural Break.


Note to Internet Explorer 7 users: this browser version has very inefficient Javascript processing engine so, when executing complex code that handles large volume of data the browser may be struggling. This could be the case when computing Natural Break ranges. A pop-up window will appear with the following warning: “Stop running this script? A script on this page is causing Internet Explorer to run slowly. If it continues to run, your computer may become unresponsive”.  Keep clicking “No” button until the process is finished (usually more than a few times!) and the browser will resume  normal operation.
 

Select Number of Ranges:
Select from a dropdown list a value corresponding to preferred number or ranges. Options vary depending on selected data classification method. Selecting ranges will trigger data refresh (ie. data ranges will be recalculated and reloaded).

Please note, Fusion Tables API has a limit of 5 colour ranges for thematic choropleth drapes. This limitation should not pose an issue for the majority of Census 2011 Online Maps users since ABS recommends 5 data ranges for thematic mapping as an optimal number.


Selecting Colours:
There are 3 single colour schemes (blue, purple and green) and one 2-colour scheme (red-blue) available for selection in the Census 2011 Online Maps application. For convenience, reverse colour option have also been added. Functionality allowing customising colours will be enabled at a later date.


Generating Thematic Map:

To complete map configuration step simply click on a blue button “Update Map”. A new thematic drape will be generated and loaded onto the map.


Please note, you may need to zoom in/ zoom out a few times to “force” update of thematic drapes (it is a known issue with Fusion Tables dynamic layer generation functionality).

Clicks on coloured polygons will open windows with detailed information about individual postcodes.


QUESTIONS

If you have any questions regarding the functionality of Census 2011 Online Maps please submit them as comments to this post. Requests for customisation of the application to specific business requirements can be sent to info@aus-emaps.com.

Thursday, July 28, 2011

Making maps with Fusion Tables

Inspired by the Guardian Data Blog I decided to explore Fusion Tables and Google Maps with Australian data. To start with, I selected a set of Socio-Economic Indexes for Areas, created from 2006 Census data, and postal area boundaries from the Australian Bureau of Statistics (ABS). The results are presented in an earlier post titled Mapping social diversity in NSW. Today I would like to share a few observations regarding creating maps with data from Fusion Tables.

As outlined in my earlier posts, although Fusion Tables is not yet a fully featured thematic mapping, analysis and publishing application however, with a little bit of effort, anyone can create informative maps which are visually attractive and fast to deploy. The best thing about Fusion Tables is that you don’t need to manage any complex infrastructure yourself and that the application is free (however, with some limitations on data storage volumes, currently capped at 250MB per account).

Spatial Data

Since Fusion Tables support spatial data only in KML format you have to convert your dataset before uploading it to the server, or alternatively, find a publicly available table that has already been uploaded by someone else.

Google provides a tool to translate SHP data into KML format and to import directly into Fusion Tables but it didn’t work for me with complex data. There are some free alternatives available (really easy to use one is QGIS, for example) but loading other than KML data into Fusion Tables will always be a multi step process.

If you decide to upload your own data, please note a couple of annoying limitations of Fusion Tables. Firstly, complex polygon structures are not supported (for example, I could not upload postcode number 0822 in Northern Territory at full resolution, yet it works perfectly with Google Maps). Secondly, some larger polygons and/or with many parts get generalised automatically as you load them to Fusion Tables as, for example, postal area 7255 in Tasmania (compare the results below – the same KML file as imported to Fusion Tables, on the left, and as displayed directly on Google Map - note green outlines on all, even the smallest islands):


Table search functionality in Fusion Tables is rather crude so, it may not be an easy task to locate what you are looking for. Not to mention that the concept of metadata is non-existent in Fusion Tables so, it is hard to know if the data you find is appropriate for your purposes.


Numeric data

Upload of tabular numeric information in csv format is very straightforward but if you disallow “Export” option up front, you will not be able to edit the data in Fusion Tables. My suggestion is to import the data as “Private” (default option) and allow for “Export”, then add new columns with formulas (if required), and disallow export only when you are ready to publish the data (if at all).

Table Operations

You can easily create a map based on data from numeric tables if those tables contain a “spatial reference” column, for example, postcode numbers (provided you can find equivalent spatial data set in Fusion Tables). To combine numeric and spatial data tables you have to use “Merge” function. My suggestion is to use “smaller table” as a starting point. For example, to create thematic map with postcodes for Sydney area only, select relevant numeric table first and then merge with a table containing postal areas for the entire NSW. Only relevant boundaries will be included in the merged table (ie. the subset of NSW postcodes). If you do the operation in the reverse order, the merged table will contain all postcodes for NSW but only a handful will have the data that can be used in creating a thematic map.

When you “Create View” (ie. copy the table - your own or from other users to your account) or “Merge” tables with spatial geometry column you will lose map formatting parameters (eg. colour setting for polygon fills, etc.). This is very unfortunate, especially when you need to retain colour schema from the original table.

Styling Map

Handling “No data” fields is not easy in Fusion Tables. The problem is that polygons with “no value” in the table default to red fill when rendered on the map (as in the example below – there was no data for 2006 postcode in the merged numeric table). A workaround is to include some value in the table for the missing record (eg. traditional -9999) if you can. Then you can specify map settings to colour only that value, for example, as white and/or fully transparent.


Fully transparent overlays (eg. if fill is set to 0% transparency) are not clickable – it is a very handy feature for handling polygons with missing data in the numeric table (ie. no information window will be displayed when the polygon is clicked). However, when your objective is to present on the map only outlines of the polygons but you still want to display information about those polygons on click of the map, you have to change transparency parameter to a value greater than 0.


Tutorials

If you are eager to start playing with Fusion Tables, Google produced easy to follow tutorial on how to create thematic maps (note, if you are working with your own data, choose “Map” option and not “Intensity Map” in the relevant step).

Tuesday, September 21, 2010

Australian Postcodes User Guide

There is a significant level of interest in postcodes as a convenient reference to locations because of perceived ease of linking them to information about individuals and businesses alike.

Over the years postcodes have been put to a wide range of uses in analysing and publishing social trends and population statistics as well as in defining sales, service, franchise or dealership areas.

Unfortunately, a misunderstanding of what postcode really is, resulting from a widely held belief about its value as a uniform referencing system, can cause many troubles for the unwary users. This article is a guide for all potential users of postcode boundary data.

Postcode Basics

Firstly, some facts about postcodes, from Australia Post site:

  • Postcodes were introduced in 1967 to facilitate the efficient processing and delivery of mail to customers.
  • Postcodes are only allocated to localities officially gazetted by State land agencies (usually, a postcode covers an area comprising of more than one locality).
  • The decision as to whether a new postcode or an existing postcode is to be allocated to a locality is based on operational efficiency.
  • Because the adoption of new or changed postcodes by customers is slow, changes are only made where significant reasons for change are established. A postcode change will only be considered if such a change leads to either enhanced service to Australia Post customers or operational efficiency to the organisation. Any such change will involve consultation with the local council/shire and residents.
Please note, the above holds true most of the time... but there are exceptions. It is also important to note that there are 3 types of postcodes: delivery areas, post office boxes and large volume receiver. Only delivery areas have meaningful reference to locations “on the ground”.


Sources of Postcode Information

Australia Post publishes a list of all postcodes from its database as a comma delimited text file. The list is updated every month and can be downloaded for free from Australia Post website.

Australian Bureau of Statistics publishes in 5 year intervals a set of Postal Area boundaries that are compiled using outlines of Census Collection Districts. They approximate official Australia Post postcode coverage areas at the time of publishing. These boundaries are available for free download in a range of popular GIS data formats. The next update of the data will be released in December 2010.

A number of private companies also produce and regularly update their own versions of postcode boundaries which are available for purchase. The two major suppliers include MapData Sciences (currently ESRI Australia) and Pitney Bowes (formerly MapInfo Australia).

There is also a number of smaller operators that may be a source of free or inexpensive information on postcodes, such as aus-emaps.com which genaralises and converts ABS postcode boundaries to KML format for use with Google Map and Google Earth and supplies large format static maps in PDF format for printing.

Postcode Finder app by aus-emaps.com


Common Problems with Postcodes

1. Changing Postcodes
Postcodes are changing over time due to evolving operational requirements of Australia Post. Changes include additions of new postcode numbers and deletions of old ones from the list as well as adjustments to composition of postcodes by adding or removing localities. This is especially the case with new, dynamically growing areas as well as some rural locations and is less of the issue for established metropolitan areas.

It means that postcodes are not a stable spatial reference. It is ok to use them as a snapshot of a particular point in time, but what often happens is that the attribution to “what area constituted that postcode X years ago” is lost from the supporting documentation and important facts can be misinterpreted by future users of the information.

This is a real problem for researchers of social trends - those who insist on using postcodes as the main location reference. As well, it may cause some legal headaches if postcodes are referenced in contracts for supply of services or franchise areas, etc. Postcodes were never meant to be used in this fashion!

2. Changing definitions of localities
On top of changes that are undertaken from time to time by Australia Post, there are also changes to boundaries defining localities which are implemented by State and local authorities. What was locality X in 2007 may now be split into locality X and Y. As the result, it is very difficult to maintain timely and consistent reference of postcode numbers to “what is actually on the ground”.

3. Imperfect procedures of referencing postcodes to localities
Where possible, Australia Post references postcodes to officially gazetted localities but localities are determined by State land agencies and boundaries are recommended by local councils. This process is not coordinated from end to end and sometimes it gets out of sync. Take for example postcode 3478 in Victoria. Australia Post lists Medlyn as a locality included in this postcode (June 2010 edition) yet this locality is not on Victoria’s register of gazetted locations. Referencing postcode numbers to localities is not a science and there can be inconsistencies.


Recommendations

If you must use postcodes, please consider the limitations outlined earlier as well as the following recommendations to avoid potential problems:

If you intend to match postcodes to official ABS statistics:
  • Your only choice is ABS version of postcodes as it will ensure consistency of definitions (that is, postcode X in the data table will correspond to postcode X depicted as an outline on the map). It is particularly relevant for Census of Population and Housing data.
  • If you need to combine those statistics with your own data (eg. client records), geocode individual addresses and then reference them to specific postcode boundaries (eg. using GIS software with “intersect” function capabilities) rather than just rely on postcode component of the address to match the records to boundaries. It is the only way to ensure a particular address/location is part of that specific postcode area.

If you intend to use postcode outlines to define custom areas:
  • Again, ABS version of postcodes is the most cost effective option as it is a free dataset.
  • Define your custom areas once and put effort in maintenance of that dataset over time. You can adjust a composition of custom areas if required (eg. add/ subtract postcodes or even adjust boundaries – but only if topological consistency can be maintained - that is, if changes to the boundary of one polygon can be reflected in the adjoining polygons).
  • It is important to acknowledge that this dataset becomes de facto your own version and that compatibility with “source” postcodes and/ or statistics published on postal area basis may be lost over time.
  • Always reference version of postcodes used in any legal documents to avoid future ambiguity as to what constituted “that” postcode at “this” particular point in time.
  • As in the previous case, if you need to reference those postcode outlines to your own data, run geocoding and then reference individual records to specific boundaries and do not rely on postcode details in the address record alone to match data with boundaries.

If you are relying on postcode boundaries from commercial operators:
  • There is really no point in aiming to always have “the latest” version of boundaries representing postcodes. After all, these are not compatible with ABS statistics (unless the company can assure they reprocess those stats “somehow” to a new representation of boundaries) and besides, what is the benefit of constantly having to reprocess your own data to accurately reference it to the ever changing representation of postcode boundaries? The only exception would be if the company supplies some other unique data that is available exclusively with their proprietary version of boundaries.
  • Although companies claim to have “the latest”, these data are rarely updated on continuous basis (ie. every month), rather in 3 or 6 monthly intervals so, you are still getting “dated” product.
  • Don’t assume you will be able to reference your address records to “the latest boundaries” using only postcode number unless your address details and postcode boundaries refer to the same time period. In most cases they don’t and you cannot avoid geocoding and then running GIS “intersect” processing of data to ensure reliability of information.


In conclusion, although postcodes appear to be well recognised spatial units for referencing locations, the complexity associated with accurate delineation of postal boundaries greatly diminishes their usefulness.

If you can, avoid using postcodes! If you can’t, be aware of all the limitations, especially when drawing conclusions with far reaching consequences.


Related posts:
Australian postcode boundaries 2016
Sales Area Management Tool 2015 Upgrade
Sales Area Management Tool with Postcodes 
Map of Australian Postcodes 
State postcode maps  
Free postcode search widget
Post code maps and population statistics

Friday, November 13, 2009

Location specific time

Dynamically updated data, like eg. weather information on aus-emaps.com site or various RSS feeds, are published with a time stamp. It is customary that time is expressed as a Greenwich Mean Time (GMT), a universal reference so anyone, in any part of the world, can determine exactly "when this thing happened". Very handy concept but in order to make the most of the information, some recalculations are often required. There are sophisticated server side scripts to deal with time but JavaScript also has a few handy functions to help with the task.

Before I move on to examples, just a quick reference to one more important concept: epoch. It is defined as time kept internally by a computer system, expressed as the number of time units that have elapsed since a specified date. Unix time epoch, used by UNIX, Linux, other UNIX-like systems, Mac OS X, as well as Java, JavaScript, C and PHP Programming languages, started on January 1, 1970 and is usually expressed in milliseconds. The epoch is what makes time related calculations so simple…


You can find many example of various JavaScript time functions by simply “googling” the term however, there is not much practical information on how to apply them. Here are a few transformations I found very useful:


Current date and time
Date() function, in its simplest form, will return current date and time as displayed on user computer.

var localtime= new Date();
// returns eg. Mon Nov 9 18:37:46 UTC+1100 2009


I often use a “combination” shown below to time stamp dynamic data (eg. frequently updated RSS feeds) in order to prevent caching so the information cannot be recalled from a local browser cache but is always called directly from the source:

var o= new Date();
var p= o.getTime();

Then I add dynamically extra parameter to source data URL :

var url= “somepage.html?p=”+p;

It is simpler than trying to get all “no-cache” headers and metatags to work consistently in all browsers.


Date and time in the past
By adding an additional parameter, the same Date() function can be used to convert a string of letters to a proper date format (ie. any date, expressed in “local time”):

var localtime= new Date(“Fri, 06 Nov 2009 04:56:00”);
// returns Fri Nov 6 04:56:00 UTC+1100 2009


Past date and time in GMT
Any past date expressed in local time can be easily converted to GMT.

var localtime= new Date(“Fri, 06 Nov 2009 04:56:00”);

var gmt=localtime.toUTCString();
// returns: Thu, 5 Nov 2009 17:56:00 UTC

GMT to local time
Reverse conversion from GMT to local time is also very easy. If your input time is expressed in GMT and you need local equivalent, just include “GMT” letters in the code to flag the input is not a local time!


var localtime= new Date(“Fri, 06 Nov 2009 04:56:00 GMT”); or
var localtime= new Date(“2009/11/05 04:56:00 GMT”);
// returns Fri Nov 6 15:56:00 UTC+1100 2009


Time in milliseconds (epoch)
Epoch is a very handy format for storing time info in a database and for all sorts of time related calculations.

var fulldate= new Date(); //returns local time as set on the user computer
var epoch=fulldate.getTime(); // converted to milliseconds


Unfortunately, I could not find any information on acceptable date formats. For example, this very frequently used Unix format does not work in JavaScript Date() function: “2009/11/06T03:42:40Z” - it has to be converted to a format that JavaScript can recognise before use.

Saturday, September 5, 2009

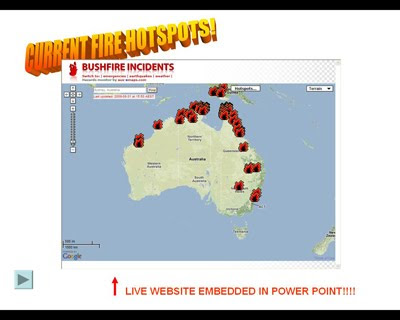
Embed web pages in PowerPoint

Have you ever given a public presentation where you had to jump between your PowerPoint slides and live web pages? Wouldn’t it be nice to be able to display web content within the PowerPoint presentation?

Or what if you need to compare two applications and displaying them on one screen would make it easy to demonstrate subtle differences? Or how about setting up “a mobile operations room/ command centre on a budget”, with only one projector and one computer to display multiple information windows?

There is a trick to accomplish all of that and impress your audience. You don’t have to be technically savvy but it requires some preparation and a simple procedure to deploy your presentation every time you are using someone else’s equipment.


Here is what to do:

1. Visit this site http://skp.mvps.org/liveweb.htm and follow instructions! Very easy :-)

All steps are very well described there so, rather than rewriting the instructions, I will just share with you a few tips from my experience:

  • Download both files from the page referenced above to accommodate various versions of PowerPoint as you never know which version will be available to you when presenting “on the road”.
  • Please remember that your embedded HTML pages will only work if there is a plug-in installed. For all practical purposes, always have two versions of your presentation (with and without embedded HTML).
  • Have a printed installation instruction sheet handy for quick reference (and possibly, write your own!) since sometimes it is easy to miss a step when installing plug-in “under pressure”.
  • Make sure you have reliable access to Internet when you choose to run embedded HTML version of your presentation (otherwise there will be no content!).
  • I strongly suggest to disable standard PowerPoint controls (like mouse-click to move to the next page or mouse-wheel functions) otherwise navigation between HTML content and PowerPoint slides can be a bit tricky. [From menu select: Slide Show | Set Up Show… and then “Browsed at a kiosk (full screen)” option.] However this will necessitate creation of custom navigation controls on each page (which is best accomplished in one go via slide master), otherwise there will be no way of moving from page to page during your presentation.
  • Last but not least, since this is Microsoft application, you need pretty powerful computer to run this set up and since PowerPoint uses web object, not a "real browser", some pages may not display correctly (especially those using fancy javascript stuff).

Have fun and good luck!

Saturday, June 6, 2009

Printing aus-emaps.com maps

Option 1: Using browser “Print” function to print a page

This option will work well for maps that fill the entire page (like in Hazards Monitor series or Postcode Finder). However, it is not optimal for printing the front page map (for which it is best to use “print” function described in Option 2 below).

Steps:
  1. From your browser menu select: File/Print Preview/ to view how the page will look.
  2. While in “Print Preview” mode, select Page Setup to set printing options (eg. turn on/off background images, show/remove header and footer and adjust information to be printed, like date, title page, etc – options will vary from browser to browser).


Hint:
  • See section on browser limitations (below) to troubleshoot printing anomalies.

Option 2: Using aus-emaps.com “print” function

This option is recommended when you want to print just a map and displayed information, without other marginalia that appear on the front page.

Steps:
  1. Print icon is located just above the map. Click on it to generate “printer friendly page”.
  2. Adjust zoom level and map extents, as required.
  3. Use browser print function to print the map (described in Option 1 above)

Advanced Use:
  1. Locate place of interest using search function (eg. open “Searches” tab under the map and type in address into a search box).
  2. Details about the location appear below the search box. Click “save” to add information about that place to a list of “saved locations”.
  3. Repeat 1 and 2 above to add more locations, as required.
  4. Select “printer friendly page” to generate a map depicting locations and showing details of all saved points of interest.
  5. Print map using browser’s print function (as described in Option 1 above)


Hint:

This print option is really handy if you need a single map with multiple locations of interest marked on it. Examples of use:
  • marking location of open houses to visit on the weekend
  • showing locations of weekend garage sales
  • marking locations of your hotel and meeting places for a business trip
  • listing drop-off points and delivery sequence for your track drivers
  • and more…


Limitations how browsers handle map overlays

Please note that not all map overlays can be printed. Eg street view overlay will not print (blue outline nor images), Wikipedia icons either…

Some older browsers, notably Internet Explorer 6, are not able to handle marker images in png format. These will be printed with black rather than transparent background.

Postcode and suburb boundaries can only be printed in IE browser but postcode numbers and suburb names will not print at all (eg. Postcode Finder map).


Use Restrictions

In general, there are no restrictions on printing aus-emaps.com pages for personal use or limited copies for use within a business organisation. However, there are certain requirements and limitations regarding public display or distribution of map information (whether for a fee or free of charge) that are imposed by Google and its data suppliers. Please consult the following pages to ensure that your intended use is within the guidelines:

Google Maps/Google Earth APIs Terms of Service
Google Maps Legal Notices
Permission Guidelines for Google Maps and Google Earth