[Persons speaking Vietnamese at home, as proportion of all persons. Source: ABS]
Monday, December 19, 2011
End of year clearance
One of well hidden gems on aus-emaps.com is a Thematic Reports Series page which contains a number of free PDF publications for download. Thematic Reports downloads page was developed as an experiment to test user sign-up and file download functionality. It might as well be put to some good use now allowing controlled access to a collection of PDF maps and data files from aus-emaps.com. So, I have just added to the list several PDF maps of postal areas covering capital cities of Australia. These maps show Census 2006 version of boundaries – still relevant for use with official ABS statistics, until the latest Census data is released (sometime in July 2012).
Labels:
Handy Tools
Map of landfill and recycle sites
Geoscience Australia has just released a new dataset mapping locations of waste transfer stations, landfill sites and recycling facilities across Australia. The database identifies 1,700 locations and provides links to the Australian Waste Industries biannual landfill surveys, which allows users to access detailed, site specific information for a range of policy issues as well as environmental and research work. Information is distributed under Creative Commons licence in PDF, KML and Access Database format.
Labels:
News
Tuesday, December 13, 2011
VicRoads traffic alerts map
Last week VicRoads announced the launch of Road Closures and Traffic Alerts application. Media release issued by the Victorian Minister for Roads, The Hon Terry Mulder MP, provided background information on the project. In particular, Road Closures and Traffic Alerts is a $924,000 initiative to provide real-time information about detours and traffic incidents, such as crashes and breakdowns, as well as road conditions during emergencies. VicRoads will update information as it receives it from its own staff and agencies such as Victoria Police, Country Fire Authority or local government.
The map-based application is accessible online and can be viewed on web-enabled mobile phones. Alerts will also be published via Twitter (but unfortunately there was no mention of RSS version).
Built with Google Map API, the application offers very familiar user interface and very simple, clean design. The list of published incidents is optimised to show only minimum detail (ie. street name, location and type of the incident) and full information is only displayed in pop-up windows on the map. Sections of closed roads, as well as available detours, are marked on the map with blue lines (visible on closer zoom), adding to clarity of presented information. The only limitation is that data is not refreshed automatically and requires manual reload to show the latest incidents.
“The website will be invaluable to road users, media and other emergency service organisations as it provides a real-time picture of incidents occurring on the roads,” Mr Mulder said. “This will help people plan their journeys in advance and help them avoid major road hazards.”
Related Post:
NSW traffic conditions map
Labels:
Featured Maps
Monday, November 28, 2011
Free imagery for WA
Earlier this month I reported on the release of new, free 30m DEM and Dynamic Land Cover data for Australia. And now there is new free imagery for Western Australia that will be of great use for mining and exploration industry: Satellite ASTER Geoscience Map of Western Australia.
Quoting from media release, “ASTER, Japanese imaging instrument flying on the US TERRA satellite, launched in December 1999, has 14 spectral bands spanning wavelengths sensitive to important rock forming minerals, including: iron oxides, clays, carbonates, quartz and “Hydrothermal” minerals such as muscovite and chlorite.”
“ASTER geoscience maps provide new mineral information not available from other current technologies. This new mineral information is valuable for more accurate mapping of the regolith cover that blankets much of Australia and finding those often small islands of bedrock materials, such as greenstones that may be associated with gold.”
The project was a collaboration between the Department of Mines and Petroleum’s (DMP) Geological Survey of Western Australia (GSWA) and the Centre for Three Dimensional Mineral Mapping Centre of Excellence (C3DMM) and was led by the Commonwealth Scientific and Industrial Research Organisation’s (CSIRO).
The State ASTER maps have been carved into 1:1,000,000 mapsheets with individual file sizes reduced to ~100 MB each and can be downloaded for free in JPG2000 GeoTIFF format from CSIRO. The complete data set (~500 Gigabytes), is available from Geological Survey Western Australia product sales.
Labels:
News
Saturday, November 26, 2011
Coal seam gas exploration map
The topic of coal seam gas is very popular in media in recent months due to well publicised protests by farmers and overall uncertainty of the impact of coal seam gas exploration on the environment, and ground water in particular. Australian national broadcaster, ABC created an online, interactive educational guide that explains key issues under debate. It is titled Coal Seam Gas – By The Numbers.
As a part of this resource, ABC published a map containing information about location of wells and exploration leases granted to private companies so users can assess what activity is undertaken in their immediate neighbourhood.
Interestingly, it is not only rural areas that experience the coal seam gas rush. As reported by ABC, there are more than 100 wells at Camden, 60 kilometres south of Sydney. The NSW Government, unlike Queensland, has not moved to create no-mining buffer zones around urban areas. However, exploration lease over entire Greater Sydney, granted to Macquarie Energy Pty Ltd, appears to have expired on 22-Oct-11…
Labels:
Featured Maps
Thursday, November 24, 2011
Bushfire season is on
Bushfire season 2011/12 started late but with venging – at least 30 properties have now been confirmed as damaged or destroyed by the fire which started about midday yesterday in Margaret River region of Western Australia. More than 400 fire fighters are battling the fire. Hundreds of people were evacuated but fortunately no fatalities.
Wet weather on the East Coast gave hope that it may be another quiet summer but unfortunately, West Coast doesn’t get much of that rain…
External link: map of current bushfires in Australia
Wet weather on the East Coast gave hope that it may be another quiet summer but unfortunately, West Coast doesn’t get much of that rain…
External link: map of current bushfires in Australia
Labels:
Featured Maps
Monday, November 21, 2011
New elevation and land cover data
Last week Geoscience Australia released a couple of new free data products for Australia: Digital Elevation Models (DEM) at 1 second (30m resolution) derived from the NASA Shuttle Radar Topography Mission (previously restricted only for research purposes) and Dynamic Land Cover, the first nationally consistent and thematically comprehensive land cover reference with 250m resolution.
The following are excerpts from respective media releases and posts on the Geoscience Australia web site:
“The new 30m DEM products improve our understanding of the national topography by producing digital elevation models at more than eighty times the resolution of the current national 9 second (250m) DEM”.
“The models were produced as part of a collaboration between Geoscience Australia, the Bureau of Meteorology (Bureau), the CSIRO and the Australian National University who have produced a number of derived products for applications such as surface water management and floodplain mapping.”
“Geoscience Australia and the Bureau are already working on phase 3 of a national scale dataset that will integrate the new DEM with regional scale (best available) topographic data. The end result will be a more accurate determination of water course activity across the country enabling communities to better prepare for water related natural hazard .”
DEM data can be downloaded for free from the National Elevation Data Framework Portal administered by Geoscience Australia (limit of 400MB per download apply).
“Land cover is the observed biophysical cover on the Earth’s surface including trees, shrubs, grasses, soils, exposed rocks and water bodies, as well as anthropogenic elements such as plantations, crops and built environments.”
“Produced in partnership with the Australian Bureau of Agricultural and Resource Economics and Sciences (ABARES), the land cover map and dataset will allow users to compare vegetation over time, at a national and local level, to monitor trends associated with short term changes brought on by cyclones, long term drought and bushfires, as well as cropping and broadacre agriculture.”
“Future updated versions of the map will identify actual changes in the land cover which could provide evidence of a need for action in areas such as water management and soil erosion, or that patterns of land use are changing due to economic, climatic or other factors.”
Grasslands are the dominand feature of Australia’s landscape, covering more than one third of the land area (37.1% or 2.8 million square kilometers). Tree dominated landscapes cover 32.1% or 2.5 million square kilometers. Shrubs cover 1.6 million square kilometers (20.7%) and intensive agriculture, including irrigated and rainfed cropping and improved pastures, cover less than 10% of Australia’s land area.
Data can be viewed online using 3D World Wind application (relevant Java framework has to be installed on the computer in order to view the application) or can be dwonloaded free of charge in GeoTiff format (~500MB).
Labels:
News
Tuesday, November 15, 2011
Sydney House Prices
On Monday Housing NSW published the latest set of housing related statistics – median rents and median sale prices - for postcodes in the Greater Metropolitan Region as well as for Local Government Areas. The information value of this dataset can be greatly enhanced by presenting it on a thematic map. For example, mapping median values allows to highlight the distribution of costly and less expensive areas within the largest capital city in Australia. And the picture is quite interesting… Explore by clicking on coloured polygons!
Direct links:
Sydney Median Prices Jun'11 by Postcode
Sydney Median Rents Sep'11 by Postcode
YoY Change in Median Prices Jun'11
Although this dataset does not attract any media headlines, it can prove quite invaluable for those hunting for a house (to buy or to rent), or for research into housing affordability and alleged property prices exuberance. Its main limitation is timeliness since sales stats refer to June quarter (so, are at least 5 months old) but rental stats are as current as you can get (ie. cover the latest September quarter). The main advantage of this dataset is that, unlike widely publicised median prices that relate to entire cities, it contains information on what is happening within small neighbourhoods around the city. The only housing related information I am aware of that covers small neighbourhoods and is published on a map, is Property Investment Map from domain.com.au
The maps above are the result of a quick exercise in matching attribute data (ie. Housing NSW data distributed in non-spatial format) with spatial boundaries (ie. ABS Postal Areas, 2011 edition), and presenting it visually using Google’s Fusion Tables and Google Map API. And although I haven’t put much effort into defining ranges in a more scientific way, they give a pretty good picture of what is happening with rental and property prices around the city.
Related Posts:
Maps and property investment
WA housing affordability index
Labels:
Featured Maps
Sunday, November 13, 2011
Mapping Australian social diversity
In July I published a set of four maps presenting social diversity in the State of NSW. My post also included basic outline of the concept behind Socio Economic Indexes for Areas (SEIFA) - a measure developed by the Australian Bureau of Statistics to describe socio-economic diversity of population residing in various localities throughout Australia. Today I would like to share the results of yet anther experiment with Google’s Fusion Tables – SEIFA indexes for all of Australia on a shareable map.
Mapping the distribution of values of different SEIFA measures gives quite an insight into the composition of population in various localities around Australia. Such maps could be used for all sorts of customer, market, business and policy analysis. Data is getting dated but is still the official version until the results from Census 2011 are released in the second part of 2012. Explore and see how your postcode is ranked against the neighbourhood!
Links to individual maps:
SEIFA’06 - Advantage/ Disadvantage
SEIFA’06 - Index of Disadvantage
SEIFA’06 - Index of Economic Resources
SEIFA’06 - Index of Education/ Occupation
For description of “what it all means”, please refer to may earlier post: Mapping social diversity in NSW.
I am testing Fusion Tables capabilities for creation of dynamic choropleth maps (ie thematic maps) so this time round, the shading of polygons is generated on the fly based on SQL query of attributes. Fusion Tables are quite responsive once it is all setup properly. There are still some issues with creating Fusion Tables with complex geometries and from several input files but that’s a topic for a separate post. I will only mention some frustration with data getting corrupted in Fusion Tables, even if they are not edited – I had to recreate all the boundaries since previous input table suddenly became “full of holes” with no apparent reason.
[UPDATE: Census 2011 version of SEIFA]
Related posts:
Postcode Finder featured by Google
Making maps with Fusion Tables
Shp data and Fusion Tables
Fusion Tables yet to ignite
Labels:
Featured Maps
Tuesday, November 8, 2011
Apple 3D mapping quest
Online and mobile mapping apps is one area where, to date, Apple’s presence is practically non existent. So far the company is relying on mapping tools and technologies provided by competitors, such as Google. However, with the acquisition of a third company with mapping related IP over a period of 24 months, Apple seems to be determined to change this situation sooner rather than later.
Mapping and GIS capabilities are an integral part of any location based service (LBS) solution and underpin a plethora of mobile applications. The company needs its own set of mapping and GIS tools to further extend its success with the mobile devices, such as iPhone and iPad. It is therefore inevitable that Apple will become a formidable player in this field at some stage.
The acquisition of C3 Technologies, a Swedish company spun out of top secret military related capabilities developed by SAAB, has been kept under wraps for almost 3 months and only now some details emerged as to the buyer. In 2009, Apple bought Placebase, which specialized in customization and layering information on maps, and just last year Poly9 with a Google Earth-like application.
The attractiveness of the newly acquired by Apple technology is best illustrated with the following video.
It is not the first of its kind on the market but definitely the most attractive due to a very high resolution of processed 3D objects. I believe Yell was the first to create a browser based application to supplement its 2D online maps. Ordnance Survey has also declared its intention to create Map of the Future using a similar approach. And Microsoft’s Photosynth offers a “consumer grade” version of the technology that anyone can play with. Let’s see what Apple can do with it…
Labels:
News
Wednesday, September 28, 2011
Fun with Planefinder.net app
I don’t know about you but I was always fascinated by planes taking off from the airport. Those “marvels of steel and engineering” look so magnificent when they lift off the ground, with majestic precision, and slowly rise into the air before disappearing in a distance.
I vividly remember my excitement, as a young kid, when I spotted a plane landing or taking off while passing a local airport on the way to or from the countryside to visit my relatives. Now, thanks to Planefinder.net and some clever technology, I can watch planes taking off and landing at almost any airport in the world, also those travelling across the globe - all day long, in real time and without leaving the house :-)
There is also an extensive range of information available on the site about individual planes and their flight details. Flight paths can be downloaded as a KML and/or shared via Twitter and Facebook. And if I miss some action, I can play back a whole day's worth of flights. The playback option allows users to select a date, the number of hours they wish to view and even the speed of the animation. Just try zooming out on the USA, set the time to 23 hours and the speed to 120x and watch. Fascinating… and very addictive! You guessed it, available for all types of smart phones as well.
First spotted on: Google Maps Mania
Labels:
Featured Maps
Wednesday, September 21, 2011
Street View imagery API
If you “like what you see” on Google’s Street View you can now access/copy that image via a simple API. Last week Google released a new, free service that allows anybody to add a static image of a Street View to a web page, email to friends for reference, or clients, or else.... Travel and real estate related sites will probably be the first to take advantage of this new service from Google but I am sure creative developers will find many more ways to put that imagery to a good use. Time will show.
Unfortunately, it is not an easy task to “take the snap” exactly how you want it if you don’t know how to work out the heading and the pitch of a Street View. But help is on hand. Keir Clarke from Google Maps Mania has just created a very simple Static Street View Wizard application that automatically generates the URL for a static Street View image. Once you have generated the URL of a static Street View, using the wizard, you can just copy it and add to an image tag in HTML page, etc. To change the width and the height of the image, just adjust manually “size” parameter with relevant values (in pixels), eg. size=600x300 will return image 600px wide and 300px high. Street View images can be returned in any size up to 640 by 640 pixels.
There is a limit of 1,000 unique (different) image requests per viewer per day. However, since this restriction applies to end users/viewers, most developers should not need to worry about exceeding their quota.
Update: alternative Google Street View Generator
Labels:
News
Saturday, September 3, 2011
Google drops Maps API for Flash
Google is continuing with rationalisation of its product portfolio. This time the axe has fallen on Google Map Flash API. Although the overall number of sites using Flash version of Google Map was relatively small, these were mainly sites offering rich display options, thematic rendering or BI-like dashboards (www.geocommons.com comes to mind as an example). Maps API for Flash applications will continue to function in accordance with Google’s deprecation policy but no new features will be developed, and only critical bugs, regressions, and security issues will be fixed.
I only recently commented how choosing to work with Google provided technology can be a risky business since you never know when Google may decide to drop support for it. Unfortunately, unlike with open source code, due to “cloudy” and proprietary nature of many of Google products developers cannot get the source code and continue on their own.
Labels:
News
Saturday, August 20, 2011
Weather on Google Map
Last week Google added weather layer to its official version of Google Map. Information is coming from weather.com and includes current temperature, humidity and wind data as well as 5 day temperature forecast. Weather icons on the map represent today’s forecasted conditions and background map is simplified when weather layer is selected to make icons more visible.
There are many sources of local weather information with global coverage so, the addition of this data layer should have been expected sooner or later. Weather information is extremely popular – these days any larger portal has at least a weather widget if not the entire weather forecasting and publishing arm (eg. Yahoo7 and weatherzone.com.au). Weather apps are amongst the best sellers on iTunes. My simple weather widget is the most popular “page” on aus-emaps.com - with over 800,000 pageviews per month.
The goalpost has moved again as weather information became another commodity item. Listing a current temperature and/or forecast is an expected norm from any news or local community focused portal or blog. Tabular listings of detailed weather information are increasingly being supplemented with maps showing all sorts of details, including animated clouds, rain intensity, lightning strikes etc. (as per example from weatherchannel.com.au below). So, mere presentation of information will no longer be a distinctive feature. Intensified competition will only foster innovation and specialisation – to the benefit of all users!
Related Posts:
Weather widget take 3
Free weather widget upgrade
Weather map
Labels:
Handy Tools
Tuesday, August 16, 2011
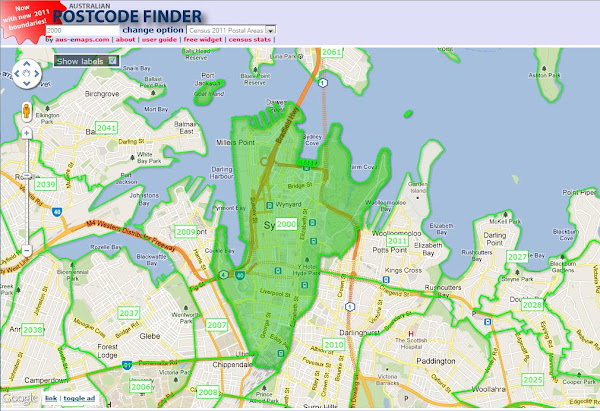
Postcode Finder upgrade
Last month Australian Bureau of Statistics (ABS) released the latest version of boundaries for use with Census 2011 data, including the so called non-ABS structures: postal areas and suburbs. It also coincided with a major upgrade to Google’s Fusion Tables, prompting me to redevelop the somewhat clunky version of Postcode Finder served from aus-emaps.com.
Postcode Finder is quite a popular tool. However, I was forced to degrade the functionality of the application after a significant hike in the cost of data service. The first version of the application was built with free postal boundaries data service provided by a third party as a Web Map Service (WMS). I wore the initial cost when the supplier introduced charges for the service but could not justify a subsequent hike in fees, opting instead to build my own version with KML data.
I wanted to avoid implementation and maintenance hassles associated with managing my own GIS infrastructure but the compromise was less than optimal solution in terms of performance and useability. Fusion Tables now offer a great alternative to WMS since it comes with own version of an “image service”, capable of real-time rendering of geographic data (eg. note the shading of a searched postcode on the map).
Functionality of Postcode Finder remains very similar to the previous version but there is a significant improvement in performance and useability (not to mention that the application is now built with version 3 of Google Map API as well). I would like to add more boundary layers over the coming weeks but it is not a straightforward task. Unfortunately, Fusion Tables suffer from some limitations in terms of handling complex polygons so, it is all subject to finding some work around, or Google sorting out the issues.
For example, in case of postal areas, I had to generalise boundaries with the Douglas-Peucker Simplification Algorithm (using 10m tolerance which reduced the file by some 30% without noticeable degradation of the boundary details however, unfortunately, not preserving topological consistency between boundaries) but it was still not enough to import postal area 6740 in WA and 0822 in NT into the Fusion Tables. I had to use 50m tolerance for those two polygons to further reduce their complexity. Google applied its own generalisation algorithms on top of it on import. The side effect is less than perfect match of adjoining boundaries at a street level resolution.
All issues aside, I hope you will find the new version of Postcode Finder much more responsive and better suited to a wider range of requirements.
Related Posts:
Mapping social diversity in NSW
Fusion Tables yet to ignite
Postcode Maps and population statistics
Large format PDF Postcode maps
Labels:
Handy Tools
Monday, August 15, 2011
ArcGIS software for $100
You may be interested to know that ESRI, developer and supplier of one of the most popular commercial GIS software, also offers a home use licence for a suite of its products. For a $100 annual fee, the ArcGIS for Home Use 12-month term license includes:
This offer is available to anyone. The catch is that the software is supplied only for non-commercial, self-education purposes. For any other use, you have to pay many thousands of dollars to acquire the software.
This is a similar program that Microsoft introduced a long time ago for its Office suite of software products. For example, if your employer has purchased Microsoft Office for use within the organisation, you can obtain the same software package for home use for under $50.
The ArcGIS for Home Use program is available worldwide. Customers in the United States can order it online. Customers outside the United States should contact their local distributor .
- ArcView
- ArcGIS 3D Analyst
- ArcGIS Geostatistical Analyst
- ArcGIS Network Analyst
- ArcGIS Publisher
- ArcGIS Schematics
- ArcGIS Spatial Analyst
- ArcGIS Tracking Analyst
This offer is available to anyone. The catch is that the software is supplied only for non-commercial, self-education purposes. For any other use, you have to pay many thousands of dollars to acquire the software.
This is a similar program that Microsoft introduced a long time ago for its Office suite of software products. For example, if your employer has purchased Microsoft Office for use within the organisation, you can obtain the same software package for home use for under $50.
The ArcGIS for Home Use program is available worldwide. Customers in the United States can order it online. Customers outside the United States should contact their local distributor .
Labels:
Handy Tools
Thursday, August 11, 2011
Visualising correlations on maps
Correlation is a statistical technique very often used in data analysis. It can show whether and how strongly pairs of variables are related. It normally involves lots of mathematical calculations but a quick insight into the phenomenon under investigation can be gained by simply superimposing the data on a map, if both datasets have a common spatial component (eg. location).
Take, for example, a case of recent London riots, mapped on MapTube. Overlaying locations of civil commotions with Index of Deprivation (ie. a measure of poverty) allows drawing a hypothesis that poverty and propensity to violent demonstrations are related. The correlation may not necessary be obvious when analysing each dataset in isolation and in a numerical form.
A point to note however is that, if the two variables are said to be correlated they may or may not be the cause of one another. In other words, correlation does not imply causality. The correlation phenomena could be caused by a third, previously unconsidered phenomenon, called a lurking variable or confounding variable. For this reason, there is no way to immediately infer the existence of a causal relationship between the two variables. Hence, one should not jump to the conclusion that “poverty is a major factor contributing to London riots” without examining the phenomenon in more detail.
As a side note, I am very surprised to see so much “red” on the London map, implying that the majority of central suburbs are poverty stricken areas - with only a few pockets of wealth on the city fringes. This picture is in big contrast to Sydney where underprivileged areas are concentrated mainly in the south-western part of the city and, most importantly, account only for roughly a quarter of the overall metropolitan area. Australia indeed seems to be a very lucky country…
London Riots Map first spotted on Google Maps Mania
Related Posts:
How maps can improve sales
Bad location can send you broke
Tracking things with maps
Maps in Viral Marketing
Mapping social diversity in NSW
Interactive Atlas of NSW
Labels:
GIS in Action
Thursday, July 28, 2011
Making maps with Fusion Tables
Inspired by the Guardian Data Blog I decided to explore Fusion Tables and Google Maps with Australian data. To start with, I selected a set of Socio-Economic Indexes for Areas, created from 2006 Census data, and postal area boundaries from the Australian Bureau of Statistics (ABS). The results are presented in an earlier post titled “Mapping social diversity in NSW”. Today I would like to share a few observations regarding creating maps with data from Fusion Tables.
As outlined in my earlier posts, although Fusion Tables is not yet a fully featured thematic mapping, analysis and publishing application however, with a little bit of effort, anyone can create informative maps which are visually attractive and fast to deploy. The best thing about Fusion Tables is that you don’t need to manage any complex infrastructure yourself and that the application is free (however, with some limitations on data storage volumes, currently capped at 250MB per account).
Spatial Data
Since Fusion Tables support spatial data only in KML format you have to convert your dataset before uploading it to the server, or alternatively, find a publicly available table that has already been uploaded by someone else.
Google provides a tool to translate SHP data into KML format and to import directly into Fusion Tables but it didn’t work for me with complex data. There are some free alternatives available (really easy to use one is QGIS, for example) but loading other than KML data into Fusion Tables will always be a multi step process.
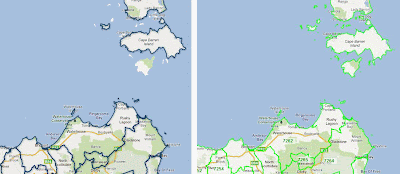
If you decide to upload your own data, please note a couple of annoying limitations of Fusion Tables. Firstly, complex polygon structures are not supported (for example, I could not upload postcode number 0822 in Northern Territory at full resolution, yet it works perfectly with Google Maps). Secondly, some larger polygons and/or with many parts get generalised automatically as you load them to Fusion Tables as, for example, postal area 7255 in Tasmania (compare the results below – the same KML file as imported to Fusion Tables, on the left, and as displayed directly on Google Map - note green outlines on all, even the smallest islands):
Table search functionality in Fusion Tables is rather crude so, it may not be an easy task to locate what you are looking for. Not to mention that the concept of metadata is non-existent in Fusion Tables so, it is hard to know if the data you find is appropriate for your purposes.
Numeric data
Upload of tabular numeric information in csv format is very straightforward but if you disallow “Export” option up front, you will not be able to edit the data in Fusion Tables. My suggestion is to import the data as “Private” (default option) and allow for “Export”, then add new columns with formulas (if required), and disallow export only when you are ready to publish the data (if at all).
Table Operations
You can easily create a map based on data from numeric tables if those tables contain a “spatial reference” column, for example, postcode numbers (provided you can find equivalent spatial data set in Fusion Tables). To combine numeric and spatial data tables you have to use “Merge” function. My suggestion is to use “smaller table” as a starting point. For example, to create thematic map with postcodes for Sydney area only, select relevant numeric table first and then merge with a table containing postal areas for the entire NSW. Only relevant boundaries will be included in the merged table (ie. the subset of NSW postcodes). If you do the operation in the reverse order, the merged table will contain all postcodes for NSW but only a handful will have the data that can be used in creating a thematic map.
When you “Create View” (ie. copy the table - your own or from other users to your account) or “Merge” tables with spatial geometry column you will lose map formatting parameters (eg. colour setting for polygon fills, etc.). This is very unfortunate, especially when you need to retain colour schema from the original table.
Styling Map
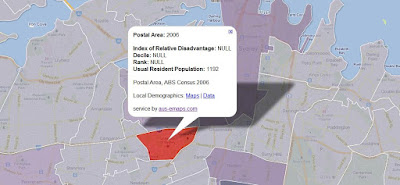
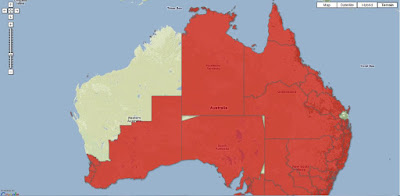
Handling “No data” fields is not easy in Fusion Tables. The problem is that polygons with “no value” in the table default to red fill when rendered on the map (as in the example below – there was no data for 2006 postcode in the merged numeric table). A workaround is to include some value in the table for the missing record (eg. traditional -9999) if you can. Then you can specify map settings to colour only that value, for example, as white and/or fully transparent.
Fully transparent overlays (eg. if fill is set to 0% transparency) are not clickable – it is a very handy feature for handling polygons with missing data in the numeric table (ie. no information window will be displayed when the polygon is clicked). However, when your objective is to present on the map only outlines of the polygons but you still want to display information about those polygons on click of the map, you have to change transparency parameter to a value greater than 0.
Tutorials
If you are eager to start playing with Fusion Tables, Google produced easy to follow tutorial on how to create thematic maps (note, if you are working with your own data, choose “Map” option and not “Intensity Map” in the relevant step).
Labels:
How To - Guides and Tutorials
Tuesday, July 26, 2011
Mapping social diversity in NSW
The concept of relative socio-economic advantage or disadvantage is neither simple, nor well defined. Australian Bureau of Statistics attempts to quantify socio-economic diversity for geographic locations with a suite of four summary measures called Socio-Economic Indexes for Areas (SEIFA).
The four indexes in SEIFA 2006 are:
Index of Relative Socio-economic Disadvantage: is derived from Census variables related to disadvantage, such as low income, low educational attainment, unemployment, and dwellings without motor vehicles.
Index of Relative Socio-economic Advantage and Disadvantage: a continuum of advantage (high values) to disadvantage (low values) which is derived from Census variables related to both advantage and disadvantage, like household with low income and people with a tertiary education.
Index of Economic Resources: focuses on Census variables like the income, housing expenditure and assets of households.
Index of Education and Occupation: includes Census variables relating to the educational and occupational characteristics of communities, like the proportion of people with a higher qualification or those employed in a skilled occupation.
While SEIFA score represents an average of all people living in an area, SEIFA does not represent the individual situation of each person. Larger areas are more likely to have greater diversity of people and households.
A SEIFA score is created using information about people and households in a particular area. This score is standardised against a mean of 1000 with a standard deviation of 100. This means that the average SEIFA score will be 1000 and the middle two-thirds of SEIFA scores will fall between 900 and 1100 (approximately).
To determine the SEIFA rank, all the areas are ordered from lowest score to highest score. The area with the lowest score is given a rank of 1, the area with the second-lowest score is given a rank of 2 and so on, up to the area with the highest score which is given the highest rank, being 2615 for a postal areas (POA) index.
Deciles divide a distribution into ten equal groups. In the case of SEIFA, the distribution of scores is divided into ten equal groups. The lowest scoring 10% of areas are given a decile number of 1, the second-lowest 10% of areas are given a decile number of 2 and so on, up to the highest 10% of areas which are given a decile number of 10.
For more information about SEIFA and its potential uses please refer to the following document: 2039.0 - Information Paper: An Introduction to Socio-Economic Indexes for Areas (SEIFA), 2006
Data tables and maps are available for reference and further reuse via Google’s Fusion Tables:
SEIFA 2006 for NSW Index of Disadvantage
SEIFA 2006 for NSW Advantage-Disadvantage
SEIFA 2006 for NSW Economic Resources
SEIFA 2006 for NSW Education-Occupation
SEIFA for Postal Areas Census 2006 (data table)
Postal Areas NSW Census 2006 Edition (postal area boundaries)
Related posts:
Interactive Atlas of NSW
Free postcodes with reference map
More free data with reference map
Postcode maps and population statistics
Labels:
Featured Maps
Monday, July 25, 2011
Shp data and Fusion Tables
A lot of geographic data in public domain is distributed in SHP format. However, Fusion Tables application supports geographic data only in KML format. Google has recognised the opportunity and is now providing a link to a “translator/loader” application to facilitate uploading of SHP files into Fusion Tables. Shpescape has been implemented with GeoDjango framework and is aimed at facilitating the process of converting and loading that vast resource of GIS data from SHP format into Fusion Tables. It should potentially improve uptake of Fusion Tables by GIS as well as broader application development community.
The concept behind Shpescape is great but, for now it fails in terms of performance. I tried the application with a modest size SHP datataset (40MB) and the result was not impressive. It took extremely long time to upload the data to the server, process it into KML and load into the Fusion Tables (short of an hour!). I know from my own experiments that converting SHP into KML takes only a few seconds with basic PHP script. Allowing for download and upload time (since 2 separate servers are involved), the whole process should be finished in a matter of minutes and not almost an hour. The biggest disappointment was that the algorithm used in Shpescape enforces generalisation of polygons and does not process “point for point” from SHP to KML [correction, it’s is actually undesirable Fusion Tables feature and not Shpescape fault]. It resulted in some polygons being converted incorrectly and/or corrupted in the process (as per image below).
Shpescape will work with small SHP files, with simple geometries but, as it stands, Fusion Tables are unable to handle full resolution datasets. Therefore it may be better to generalise SHP files before loading into Fusion Tables via Shpescape.
Related Posts:
Converting shapefile to KML
Converting csv data into shapefile
Labels:
Handy Tools
Thursday, July 21, 2011
New style for Google Maps
There is a good chance that you haven’t noticed subtle changes to cartographic design of Google Map that the company is continuously implementing. However, if you put different versions of Google Map side by side, it becomes very obvious how dramatically the appearance changed over the last few years. The key objective behind those changes is “… to make the map cleaner, more focused, more visually harmonious, and easier to use.”
“…Some highlights to look out for are a brighter and more cheerful colour palette, a more integrated and less visually noisy labelling style, subtle improvements to footpaths and minor roads, and cleaner building and land parcel rendering.”
One thing Google cannot be accused of is that it does not put continuous efforts into upgrading of its products and services. In fact, that constant tinkering with features and functionality gives an impression that all Google products are in a permanent state of development. With Google we never know what functionality is coming and when it will be available, or whether the product or service will survive in the long run as the company is not afraid to pull down underperforming applications. The most recent announcement is the closure of Google Labs with 56 experimental products. Product-specific Labs sites, like Gmail Labs, Google Maps Labs and Search Experiments, aren't affected by the decision.
First spotted on Google Maps Mania
Monday, July 18, 2011
Fusion Tables yet to ignite
Google is making consistent but slow progress with Fusion Tables, gradually enabling various functionality options to turn the application into a comprehensive data visualisation and sharing package. The idea behind Fusion Tables is simple – allow people to upload data in a tabular format, then present that data with graphs or geocode/ match to spatial data and display on Google maps as thematic overlays or location points. Undoubtedly, the integration of tables, maps and graphs is Google’s response to emerging trend for “data marts” and “data journalism”.
I wrote about Fusion Tables with great excitement a year ago, concluding that the application has a potential to evolve into a formidable competitor to PostGIS, ArcSDE , Oracle Spatial or SQL Server for basic GIS applications. Although a recent addition of dynamic styling capabilities takes Fusion Tables closer to that goal, it is still a long way for the application to reach that point. Unfortunately, the implementation of Fusion Tables is in typical, of late, Google fashion – unattractive and rather complex to follow so, most likely only “hard core” developer community will be taking advantage of it. The limit of 250MB of data per account is not helping either. There is no catalogue of available data (although basic text search is enabled) and no metadata for public tables so, it will not facilitate sharing.
Nevertheless, you can already make nice and very responsive maps with Fusion Tables, as in this example from Guardian’s Data Blog:
Related Posts:
Google launches Fusion Tables
Ingenuity of Google Map architecture also its main limitation
Wednesday, June 29, 2011
HTML5 and maps
For the unwary it may come as a big surprise - HTML5 is here! More and more online mapping applications are implemented in HTML5 standard, taking advantage of <canvas> element to extend the functionality and presentational capabilities in a browser environment. All modern browsers now support the standard.
The canvas element allows for dynamic, scriptable rendering of 2D shapes and bitmap images. Below is an example that illustrates the benefit of using <canvas> element in browser based mapping applications. This map allows users to specify a minimum terrain height parameter at which to display the layer and the layer is redrawn dynamically to display the information on the map.
With the support for SVG just implemented in Internet Explorer 9, there are now two complementary approaches to drawing objects in all modern browsers: <canvas> and SVG. It is best to think about <canvas> as akin to “raster” and SVG as “vectors”. This way it is easier to decide which approach is more suitable for a specific purpose.
First spotted on: Google Maps Mania
Related post: Is SVG ready for comeback?
Tuesday, June 14, 2011
Weather widget take 3
This week I released another version of a free weather widget with information on current temperatures and weather forecast for close to 200 locations around Australia (as in the right navigation panel of this blog). It is powered by the same database as the second version of the widget but information is presented differently to make the widget more suited for blogs and blog-like websites. For detailed instructions on how to set it up on your site please visit aus-emaps.com.
The latest weather information is from a local database that is updated twice an hour from official data and web services provided by the Bureau of Meteorology. Unfortunately, it is not possible to match all localities for which the Bureau releases forecasts with locations of weather stations hence not all selections display current temperature. Similarly, not all localities have a weather forecast for more than just a single day.
The widget displays weather information for a single location at a time and the default location is Sydney. Webmasters can easily set the preferred location by adding a reference code of that location at the end of the widget’s URL address. End users can change the displayed location by clicking on the location name and selecting an alternative location from a drop-down list. One to seven day weather forecast information for a specific location can be accessed by clicking on “This week” link in the top right corner of the widget. Weather description for individual days of the week can be obtained by moving a mouse over the weather icons.
Version 2 of the weather widget became quite popular. It now has over 200,000 displays/loads a month (and close to 1M page views, by 38,000 unique visitors) and brings a steady flow of traffic to aus-emaps.com home page. I hope this version becomes equally popular and widely used. Any feedback greatly appreciated.
Labels:
Handy Tools
Monday, May 30, 2011
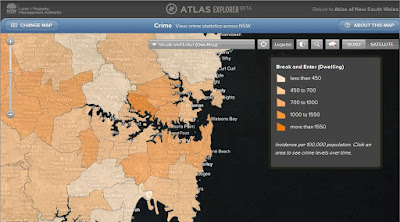
Interactive Atlas of NSW
The Atlas of New South Wales is an initiative of the Land and Property Management Authority and it was created with the objective of providing detailed statistics across a range of topics to educational institutions and the broader community. It is built with Bing Map so, provides very familiar to many, simple and intuitive interface to government information.
All the information is presented as a series of thematic map overlays in four categories:
Users have a choice between satellite image or roads map as a base layer and can adjust transparency level of thematic overlays. Each overlay is accompanied by a comprehensive legend, explaining the meaning of presented data. A click on individual region brings up a pop-up window with information about the region, presented as charts and gauges.
The Atlas of New South Wales is quite responsive considering the amount of data that is required to present thematic overlays. It would benefit though from a bit more legible charts and access to source data in a tabular format and/ or for download. Overall, the application is well built and very simple to navigate through.
All the information is presented as a series of thematic map overlays in four categories:
- People (eg. population, health, housing, religion, indigenous population, indexes of relative advantage/disadvantage, crime);
- Economy (eg. labour force, taxation and revenue, and production of fruit and vegetables, oils and grins, and livestock);
- History (eg. information on settlement, State elections and boarders); and
- Environment (including vegetation, geology and soils, and locations of national parks).
Users have a choice between satellite image or roads map as a base layer and can adjust transparency level of thematic overlays. Each overlay is accompanied by a comprehensive legend, explaining the meaning of presented data. A click on individual region brings up a pop-up window with information about the region, presented as charts and gauges.
The Atlas of New South Wales is quite responsive considering the amount of data that is required to present thematic overlays. It would benefit though from a bit more legible charts and access to source data in a tabular format and/ or for download. Overall, the application is well built and very simple to navigate through.
Labels:
Featured Maps
Thursday, May 26, 2011
Free data a GFC casualty
The US government has been a proponent of free data for quite a while now and over the years it established a number of national programs to allow easy access to wast resources of public information. However, the annual budgets for e-government initiatives were slashed by 75% last month, putting in question the survival of such programs like data.gov (it is the repository for publicly available data that was promised as a platform to power software and analysis created by and for the public). Comments from federal CIO Vivek Kundra indicate that data.gov will not be shut down but “…there will be no enhancements or other development to address needs for improvement”. So, although the policy of free data remains unchanged, significant cost of delivering that policy may be its ultimate “undoing”.
Meantime, in Australia, the progress towards opening up government data vaults has taken another step forward. Earlier this week Australia's Information Commissioner, John McMillan, unveiled eight new rules for Federal agencies to adhere to when considering the publication of government data. These rules are:
The Principles are not binding on agencies, and operate alongside legal requirements about information management that are spelt out in the FOI Act, Privacy Act 1988, Archives Act 1983 and other legislation and the general law.
Despite the launch of data.gov.au portal, there is no federal program in Australia to facilitate access to public data on a large scale (ie. the US style) and the onus so far is on individual agencies to manage the dissemination of public information in their possession. State and Territory governments are pursuing their own initiatives. This “piecemeal approach”, although slower in implementation, may prove to be a more sustainable model for enabling access to public data, considering the vulnerability of large scale initiatives to budgetary pressures of the government of the day in these uncertain times.
Meantime, in Australia, the progress towards opening up government data vaults has taken another step forward. Earlier this week Australia's Information Commissioner, John McMillan, unveiled eight new rules for Federal agencies to adhere to when considering the publication of government data. These rules are:
- Open access to information – a default position,
- Engaging the community,
- Effective information governance,
- Robust information asset management,
- Discoverable and useable information,
- Clear reuse rights,
- Appropriate charging for access, [So, not entirely free access!]
- Transparent enquiry and complaints processes
The Principles are not binding on agencies, and operate alongside legal requirements about information management that are spelt out in the FOI Act, Privacy Act 1988, Archives Act 1983 and other legislation and the general law.
Despite the launch of data.gov.au portal, there is no federal program in Australia to facilitate access to public data on a large scale (ie. the US style) and the onus so far is on individual agencies to manage the dissemination of public information in their possession. State and Territory governments are pursuing their own initiatives. This “piecemeal approach”, although slower in implementation, may prove to be a more sustainable model for enabling access to public data, considering the vulnerability of large scale initiatives to budgetary pressures of the government of the day in these uncertain times.
Monday, May 23, 2011
Geospatial Revolution continues
Pennsylvania State University has just released another short video in the series titled “Geospatial Revolution”. This is the fourth 15 min. episode outlining virtues of geospatial technologies and how they can assist scientists and local communities.
Episode 4 is divided into four chapters. The first chapter explains how experts studying climate change use digital maps to monitor glacier ice melt, deforestation and carbon emissions over time. Another chapter explains how geospatial technology can help aid workers anticipate food shortages around the world. The following chapter explores how geospatial technology helps track the spread of disease. And the closing chapter highlights the Map Kibera project, which empowered the people of an unmapped area of Nairobi, Kenya to map their essential facilities and provide a voice for the more than 200,000 residents.
Bookmark and share all 4 episodes via aus-emaps.com YouTube video player.
Related Posts:
Geospatial Revolution
Labels:
GIS in Action
Thursday, May 19, 2011
Mapping feral animals in Oz
Over the last two centuries Australia has been plagued by many feral animal brought in by settlers from Europe and other parts of the world. This includes rabbits, foxes, camels, pigs and many, many more species. FeralScan is a collaborative project between Federal and State Governments, private organisations and community to map and monitor distribution of various feral animals on Australian continent. By mapping the damage caused by these animals, FeralScan can help to identify when, where and how to control these animals in order to reduce their impact on the environment.
For example, there are more than 1 million wild camels currently roaming the Australian desert and causing damage to water supplies and disturbing Aboriginal communities. CamelScan, a crowdsouced initiative under FeralScan project, allows anyone to report sightings of feral camels in Australia on a Google Map. Thanks to this initiative scientists involved in the project will be able to develop regional maps, as well as national picture of where feral camels occur, and work out where they congregate in different seasons.
First spotted on : Google Maps Mania
Labels:
Featured Maps
Thursday, April 7, 2011
Maps and property investment
There is an old adage that the three most important rules for selecting a property for purchase are: location, location, location. So, maps should be one of the primary tools in making the purchase decision. With the advent of Google Maps, Bing Maps and plethora of other online mapping applications, all real estate portals integrated mapping based search options into their websites. However, mapping applications presenting analytical information on the state of the property market in various parts of the country are only starting to be brought to life.
Property Investment Map on domain.com.au is the first analytical map released by the major Australian real estate portal. It contains a set of thematic overlays presenting information on gross rental yields, capital gains, vendor discounts and top performing areas - by suburb, for the entire Australia (excluding ACT). Information is available separately for houses and units, as 1 year or 5 year trend measures.
Property Investment Map provides invaluable insights into the dynamics of the property market on a local scale. For example, using the map investors can pinpoint suburbs with good rental yields and capital growth prospects. These areas are the most desirable for investors as high rental yields imply attractiveness of the location to renters as well as availability of properties at prices still offering good value. At the same time, high capital gains yields over short as well as longer term imply consistency in appreciation of properties in a given area over time. Eastlakes in central Sydney is one suburb displaying such characteristics in relation to units -median price increased 17% in 2010 and further rise of 3% is predicted for 2011.
Totally different market dynamics can be demonstrated on example of Rozelle, a suburb just west of the CBD. Despite showing high gross rental yield for units in the last year, it has relatively low rates of capital gains over one as well as 5 year period. It could imply this suburb was overpriced in the past and only now rental yields for units have increased to the level that makes them attractive again for investment purposes (median price dropped 4% in 2010 and prediction for 2011 is 0% growth). If history is to repeat, there is a good chance prices could overshoot again if Rozelle is suddenly “rediscovered” by investors. Property Investment Map cannot give all the answers so, the picture would have to be validated with local knowledge before making any decisions.
Property Investment Map should be in the toolbox of not only investors but also anyone serious about purchasing a property. The only limitation of the map is lack of details on how the information was derived (eg. methodology for data range determination). It is a good starting point for deciding on alternative locations for investment, although it would also be nice to have a numerical version of the dataset available for more detailed comparisons.
Related Post:
WA housing affordability index
AllHomes Property Map
REIV maps auctions statistics
Map of Melbourne house prices
Sydney house prices
Labels:
Featured Maps
Wednesday, April 6, 2011
Spatial services directory
The task of finding the right supplier is never easy, especially when services are concerned. Industry specific directories can be a good starting point for preselecting potential candidates for contact and further evaluation. SpatialSource.com.au is the leading portal for the Australian spatial industry. It publishes a directory of suppliers of “all things spatial”. There are over 200 providers listed in a variety of categories, divided into five main groups: Data Supply, Geospatial Services, Hardware Supply, Services to Spatial Industry and Software Supply - from top tier multinationals to small operators like aus-emaps.com. Bookmark the following link for your future reference: http://directory.spatialsource.com.au/
If you are a local supplier of spatial products or services consider registering your company in Spatial Source Online Directory - listing is free. The directory offers good exposure to potential customers. Help your prospective clients find you!
Related Post: New spatial industry news portal
If you are a local supplier of spatial products or services consider registering your company in Spatial Source Online Directory - listing is free. The directory offers good exposure to potential customers. Help your prospective clients find you!
Related Post: New spatial industry news portal
Monday, April 4, 2011
Disasters and maps
7 February 2011 marked the second anniversary of the worst bushfire tragedy in Australian history - 173 people died and 414 were injured as the result of infernos raging around the State of Victoria. The Black Saturday Bushfire was a very traumatic event for many Australians, those directly affected by the fires but also those thousands who got emotionally and personally involved in post event forensic studies, clean up, counselling, rebuilding, Royal Commission and general assistance through voluntary work or collection of donations. The whole nation felt the pain and helplessness in the wake of such an enormous tragedy.
After a period of a relative calm over the last two years Australia has been struck again by several major natural disasters, such as flush floods in Queensland and Victoria, tropical cyclone Yasi, or bushfires in Western Australia. Events like these bring online crowds of people: those caught inadvertently in the incidents, or those concerned about safety of their family members and friends, but above all, “curious onlookers” from around the world who just would like to know what is happening. All those people are looking for basic information, such as maps of places to identify where “these things” reported in commercial and social media are happening, as well as anything that relates to progress of the event, likely scenarios it may evolve into and the impact on people, infrastructure and the surrounding environment.
In the first instance they turn to official sites run by State authorities - those that issue the alerts and warnings - and of course the Australian Bureau of Meteorology. When they can’t find what they are looking for, or the information is not in the format that is meaningful, they turn to online search engines seeking more details about the event. It is therefore not a coincidence that during the times of natural disasters the traffic to sites providing information on maps goes through the roof. A question comes to mind if there really is enough tools in the public domain to keep general public fully informed. Has anything changed since Victorian bushfires of 2009?
In an ideal world, all the relevant information would be provided by the authorities, along with alerts, warnings, evacuation orders, road closures and detour routes, situation briefs etc. And through all possible channels: online, stationary and mobile phones, radio and TV, and in all formats: text, audio and video broadcasts and online streaming, printed as well as static and interactive maps, and above all, web services for republishing the information through media and social channels. But that is still only a distant dream. The reality is that information is very fragmented, differs in formats and content from State to State and ultimately in reliability, accuracy and timeliness.
So, what information is actually available, in spatial format, to an average person interested in a particular event? Let’s start with bushfire related information as there is quite a few resources available...
Part 1: Mapping Bushfires
Detection of fire hotspots from satellites has been around for quite a while and Australia has two systems delivering such information that pre-dates Victorian bushfires of 2009: Geoscience Australia’s Sentinel and Landgate’s FireWatch. Both are using data obtained from the NASA Earth Observation Satellites Terra and Aqua which pass over Australia up to three times a day (although a revisit of the same area is only two times a day). Although data has some limitations, like timeliness due to infrequent revisit cycle or inability to detect hotspots through thick smoke and clouds, these applications provide excellent location reference for larger fire outbreaks throughout Australia. Geoscience Australia publishes the data in KML, WFS and WMS formats. I use those in my Hazard Monitor Bushfire Incidents map to publish an alternative view of the information. FireLocator from PitneyBowes provides yet another version of the same data in Silverlight format and with Bing Map in the background.
North Australia Fire Information is an application dedicated to monitoring fires in the northern part of Australia. In addition to satellite detected fire hotspots it also includes information on fire scars from past bushfires. Some of the information available on this site can be accessed in KML and WMS formats.
State authorities responsible for emergency alerts and response to natural disasters are publishing on their respective websites summaries of information on the latest incidents. Victorian Country Fire Authority (CFA) publishes a summary of incidents in a tabular format and on a Google Map. The information is also available as RSS feeds (locations are not georeferenced, hence cannot be directly imported into maps).
In NSW Rural Fire Service (RFS) publishes its version of summary of incidents - as a list and a map. Georeferenced RSS feed is also provided.
Both Bushfire Incidents map and FireLocator (developed in late 2009) are using the above feeds to display information about the latest incidents on the maps. During the peak of Victorian bushfires Google released its own application that mapped these feeds and showed satellite imagery of smoke and cloud cover.
Tasmania Fire Service (TFS) is another agency that publishes fire incidents information and a map as well as distributes the information via RSS (non-georeferenced) and KML. And South Australian Country Fire Service (CFS) publishes map and incidents in a similar fashion to already mentioned States (their RSS feed is also not georeferenced).
There are no interactive maps with the latest incidents for Queensland and Western Australia and those states do not publish RSS feeds in the format that could be easily reused for displaying the information in third party mapping applications.
The most recent additions to the list of online bushfire related information sources are BushfireConnect and everymap.com.au. Built with Ushahidi, these online mapping applications aim to publish information supplied by the public located in the affected areas, either by lodging reports online, or via SMS or Twitter (ie. crowd sourcing). They also republish RSS alerts from State authorities. Not the easiest and the most intuitive tools to use but these initiatives are attempting to engage a wider community in reporting of incidents so, deserving all the support.
At the time of major disasters media and private individuals create maps and various applications to share the information about a particular event. Examples include a Black Saturday feature created by ABC that allows users to explore timeline of events on an interactive map, or Google’s MyMap version created by a private individual as a static record of events (presented here on aus-emaps.com shareable map).
[to be continued…]
Related Posts:
Perth Bushfires
After a period of a relative calm over the last two years Australia has been struck again by several major natural disasters, such as flush floods in Queensland and Victoria, tropical cyclone Yasi, or bushfires in Western Australia. Events like these bring online crowds of people: those caught inadvertently in the incidents, or those concerned about safety of their family members and friends, but above all, “curious onlookers” from around the world who just would like to know what is happening. All those people are looking for basic information, such as maps of places to identify where “these things” reported in commercial and social media are happening, as well as anything that relates to progress of the event, likely scenarios it may evolve into and the impact on people, infrastructure and the surrounding environment.
In the first instance they turn to official sites run by State authorities - those that issue the alerts and warnings - and of course the Australian Bureau of Meteorology. When they can’t find what they are looking for, or the information is not in the format that is meaningful, they turn to online search engines seeking more details about the event. It is therefore not a coincidence that during the times of natural disasters the traffic to sites providing information on maps goes through the roof. A question comes to mind if there really is enough tools in the public domain to keep general public fully informed. Has anything changed since Victorian bushfires of 2009?
In an ideal world, all the relevant information would be provided by the authorities, along with alerts, warnings, evacuation orders, road closures and detour routes, situation briefs etc. And through all possible channels: online, stationary and mobile phones, radio and TV, and in all formats: text, audio and video broadcasts and online streaming, printed as well as static and interactive maps, and above all, web services for republishing the information through media and social channels. But that is still only a distant dream. The reality is that information is very fragmented, differs in formats and content from State to State and ultimately in reliability, accuracy and timeliness.
So, what information is actually available, in spatial format, to an average person interested in a particular event? Let’s start with bushfire related information as there is quite a few resources available...
Part 1: Mapping Bushfires
Detection of fire hotspots from satellites has been around for quite a while and Australia has two systems delivering such information that pre-dates Victorian bushfires of 2009: Geoscience Australia’s Sentinel and Landgate’s FireWatch. Both are using data obtained from the NASA Earth Observation Satellites Terra and Aqua which pass over Australia up to three times a day (although a revisit of the same area is only two times a day). Although data has some limitations, like timeliness due to infrequent revisit cycle or inability to detect hotspots through thick smoke and clouds, these applications provide excellent location reference for larger fire outbreaks throughout Australia. Geoscience Australia publishes the data in KML, WFS and WMS formats. I use those in my Hazard Monitor Bushfire Incidents map to publish an alternative view of the information. FireLocator from PitneyBowes provides yet another version of the same data in Silverlight format and with Bing Map in the background.
North Australia Fire Information is an application dedicated to monitoring fires in the northern part of Australia. In addition to satellite detected fire hotspots it also includes information on fire scars from past bushfires. Some of the information available on this site can be accessed in KML and WMS formats.
State authorities responsible for emergency alerts and response to natural disasters are publishing on their respective websites summaries of information on the latest incidents. Victorian Country Fire Authority (CFA) publishes a summary of incidents in a tabular format and on a Google Map. The information is also available as RSS feeds (locations are not georeferenced, hence cannot be directly imported into maps).
In NSW Rural Fire Service (RFS) publishes its version of summary of incidents - as a list and a map. Georeferenced RSS feed is also provided.
Both Bushfire Incidents map and FireLocator (developed in late 2009) are using the above feeds to display information about the latest incidents on the maps. During the peak of Victorian bushfires Google released its own application that mapped these feeds and showed satellite imagery of smoke and cloud cover.
Tasmania Fire Service (TFS) is another agency that publishes fire incidents information and a map as well as distributes the information via RSS (non-georeferenced) and KML. And South Australian Country Fire Service (CFS) publishes map and incidents in a similar fashion to already mentioned States (their RSS feed is also not georeferenced).
There are no interactive maps with the latest incidents for Queensland and Western Australia and those states do not publish RSS feeds in the format that could be easily reused for displaying the information in third party mapping applications.
The most recent additions to the list of online bushfire related information sources are BushfireConnect and everymap.com.au. Built with Ushahidi, these online mapping applications aim to publish information supplied by the public located in the affected areas, either by lodging reports online, or via SMS or Twitter (ie. crowd sourcing). They also republish RSS alerts from State authorities. Not the easiest and the most intuitive tools to use but these initiatives are attempting to engage a wider community in reporting of incidents so, deserving all the support.
At the time of major disasters media and private individuals create maps and various applications to share the information about a particular event. Examples include a Black Saturday feature created by ABC that allows users to explore timeline of events on an interactive map, or Google’s MyMap version created by a private individual as a static record of events (presented here on aus-emaps.com shareable map).
[to be continued…]
Related Posts:
Perth Bushfires
Subscribe to:
Posts (Atom)