The traditional way to publish maps over the Internet was to use specialised mapping servers to render GIS data into a simple image and then to serve that single image to a browser for display. A new map was generated every time users panned to a different location or changed zoom level (since there is an infinite number of combinations of map extents and zoom levels it was impossible to generate those maps in advance). And those maps were always less than perfect because every display rule had to be predefined for the entire map and for every possible zoom level. In case of very detailed maps the complexity of defining those rules was very often beyond the capacity of map creators.
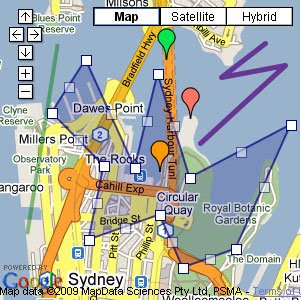
 There are many ground breaking solutions applied in the design of Google map but I want to focus on one more revolutionary idea of Google team. What started as simply clickable markers on the map has now been extended to include polylines and polygons – that is, they have found a way to include vector data utilising VML and SVG capabilities of standard browsers. Sure, there is a capability to generate vector based maps in pure SVG, Flash or Java but no one succeeded to do it on a mass scale in a standard browser environment and without additional plug-ins.
So, where are the limitations then? The main are outlined below, with some commentary.
Limits on Dynamic Content
Pre-designed map tiles approach is brilliant for speed and performance but it does not allow for dynamic map content, unless it is in vector format as points, polylines or polygons (and there is a limitation on how much JavaScript can handle - more on this below) or is delivered using external map server (ie. reverting to traditional approach).
Although Google exposed a number of server side processes to developers, like geocoding, parsing KML, etc, but there is no access to "map server" side of the application simply because Google Map does not have one! The only way to add tiled content without deploying your own map server is to follow Google's tedious process of creating 2-3 different representations of the map for various scales - as graphic images - then cutting them into tiles. There are good tools around to do it but still, it is a very labour intensive approach (for example: Maptiler for images and gmapcreator for GIS data).
Limits on capability to work efficiently with external map servers
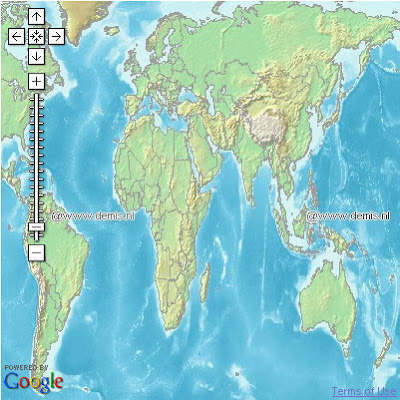
Adding content dynamically from external map servers is not without the problems. Even if you master Open Geospatial Consortium’s standards on Web Map Service (WMS) and Styled Layer Description (SLD) there is a good chance that the service you intend to use will not support Mercator projection required for Google maps (eg. very popular topographic map service from demis.nl is one such case). And for obvious reasons Google maps cannot be presented in other popular projections.

Then there is an issue of multiple map tiles again. The bigger the viewing area, the more 256px by 256px tiles are required to present the complete map on the screen. Each tile is a single call to external map server and, with dynamic data, each tile has to be generated from scratch. Each pan and zoom on Google Map translates to multiple calls to external map server. In times of high demand this may flood map server with requests and bring it to halt.
Limited capacity to display vector data
Ability to display vector data in Google map created unreasonable expectations within developer community as to its capacity to handle such data. Problems with displaying tens of thousands of points on the map led to development of add-on libraries to efficiently manage display of such large datasets. Google also implemented line encoding for handling more complex vector line segments. However, unlike Java or Flash/Flex plug-ins, applications reliant purely on Javascript have very limited access to computer processing power. Therefore the ability of Google map to display complex shapes from vector data will always be limited.
Browser memory leaks
There is another limitation often overlooked by developers although this is not Google map issue but rather relating to bad programming practices. Continuous refresh of dynamic content (ie deleting and creating new objects), if not programmed properly, may lead to a gradual build up in memory use by the browser - to the extent that the computer will stop responding to user actions. It is not a big issue with smaller applications used for a few minutes at a time but becomes a significant problem when they get more complex and are used on continuous basis.
So, in conclusion, can Google Map ever aspire to be a fully fledged GIS?
There is definitely a chance it will evolve into a very powerful tool, sufficient for many common GIS applications. However, to be considered in this category it requires at least two functional additions:
1. Map server (ie a web service that would convert user data into an image representation and deliver it back as tiles, same concept as Google chart service);and
2. Dynamic vector data management module – server and client side (ie. server side to serve generalised data suitable for the current map zoom level and client side to efficiently store that data for the session and to display appropriate level of detail without the need to continuously download the data from the original source).
Google has already come up with the initiative to store and distribute geographic data for anyone free of charge so, the two above would be a natural progression in the quest to efficiently serve that data.


