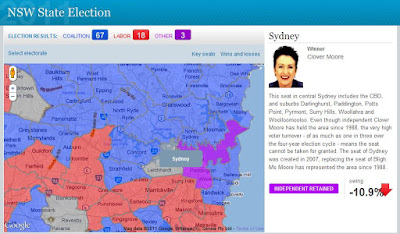
The map is quite intuitive to use – just move the mouse over the polygon to reveal electorate name and click on a polygon to bring additional information about the electorate in a side panel. As polygons are created from point data they can be highlighted on mouse over. The downside of this approach is that, because of the limit on how many points browsers can handle, developers had to sacrifice the quality of boundary outlines, keeping points to a minimum. The effects are gaps and overlaps in individual polygons when you zoom too close.
As noted in GIS related media, this was the only map used in reporting election results in NSW. Why this lack of interest to commit resources and present “the battlefield” spatially? I suspect that it may have something to do with the availability of State electoral boundary data – a quick search on the Internet did not yield any results. Creating such boundaries from secondary information sources may have proven too big of a task.
First spotted on: Communica


5 comments:
Hi Arek, I am trying to track down state electoral boundaries. Will keep you posted. Jose
You can download MID/MIF files of the 2007 election boundaries at http://www.elections.nsw.gov.au/about_elections/electoral_boundaries/electoral_maps
Thanks for the info. It would be handy to locate boundaries for all States.
How can anyone be sure that 2007 version is still current? Federal electorates are regularly changing, I suspect State as well. Electorate maps available from the site show 2004 Local Government Areas which has changes several times since then...
Hi Arek,
I understand this is not on topic to the election maps, but wondering if you would know of a way to create polygons on a map of Australia based off of the map found at http://www.regionalmediaworks.com.au/www/default.asp?contentID=27
Hi Ananymous,
Try this page:
http://www.acma.gov.au/licplan/defmaps/name.html
Post a Comment